Gradient Bar Graph Presentation – Market Competitiveness Analysis
RJ0300060_6
- Last Update 05/04/2025
- File Size 0.9MB
- # of Slides 2
- File Format PPTX
- Slide Ratio 16:9
- Color
Keywords
- #Content-Based Slides
- #Design-Based Slides
- #Market and Competitor Analysis
- #Graph
- #Competitor Analysis
- #Market Analysis
- #Horizontal Bar
- #Horizontal Bar Chart
- #16:9
- #gradient bar chart PowerPoint
- #bar graph slide template
- #market analysis chart
- #competitive analysis template
- #data comparison presentation
About the Product
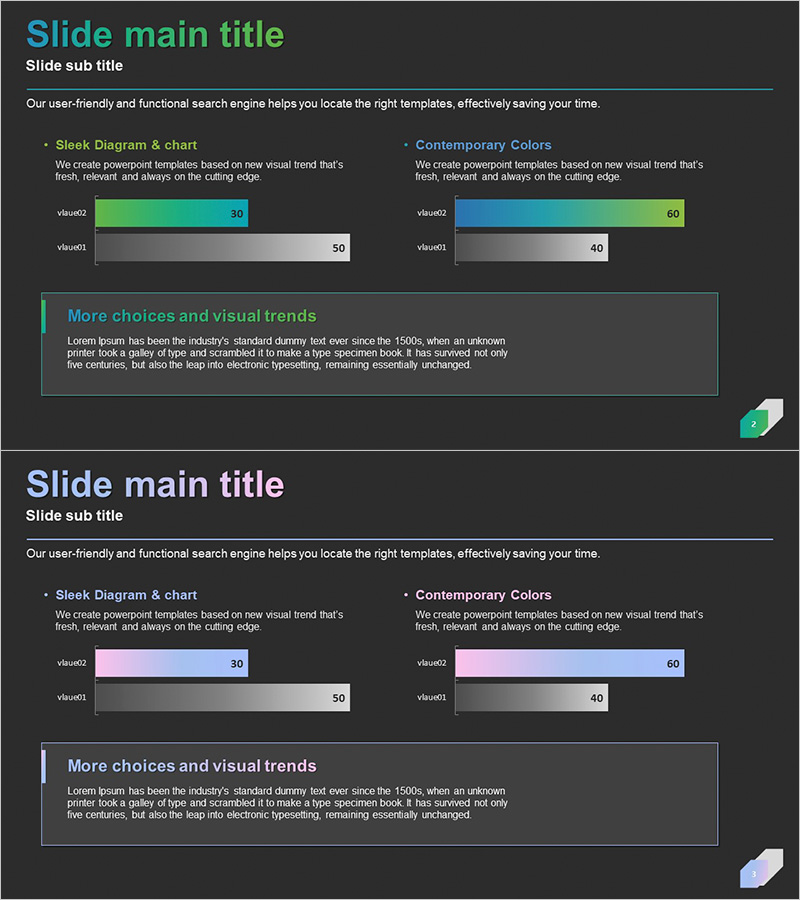
A gradient bar chart PowerPoint slide optimized for market competitiveness analysis and data comparison. The slide features green, pink, and blue gradient effects that visually contrast two key metrics, with clear numerical labels displayed on each bar. The 2-slide set provides identical layouts with multiple color combinations for immediate use in presentations and reports. Delivered in 16:9 widescreen PPTX format, compatible with all presentation environments.
Usage Points
-
Main Usage
Visualize two metrics simultaneously for market competitiveness analysis, competitor comparison, and sales performance benchmarking. The gradient effect emphasizes numerical differences, making it ideal for reports, proposals, and executive briefing slides.
-
How to Use
Enter actual values into the 'value02' and 'value01' text boxes on each slide; bar lengths adjust automatically. Two color combination versions are provided—select the one matching your presentation theme and corporate branding. Modify legends and titles to adapt the chart for various comparative analyses.
-
Recommended For
Marketing managers, sales directors, executives, consultants, and analysts who need to support decision-making with quantitative data. Particularly effective for quarterly performance comparisons, market share analysis, and competitive advantage presentations in B2B contexts.
-
Slide Structure
2-slide set. Each slide is divided into left and right sections, each containing 2 items (value02 and value01) displayed as horizontal bar charts. One version features green-to-pink gradient; the other uses blue-to-green gradient. Numerical labels appear to the right of each bar for precise data communication.
Related Products
-

Pencil Bar Chart for Market Analysis – Visual Competitiveness
#Market and Competitor Analysis #Graph #Other
-

Mobile SNS Market Analysis Graph – Visualizing Competitor Analysis Data
#Market and Competitor Analysis #Diagram #Graph
-

Data Analysis Bar Graph – Essential for Market and Competitor Analysis
#Market and Competitor Analysis #Graph #Competitor Analysis
-

Competitor and Market Analysis Slide – Pink & Bluegreen PowerPoint Template
#Market and Competitor Analysis #Graph #Competitor Analysis
