Competitor and Market Analysis Slide – Pink & Bluegreen PowerPoint Template
RJ0400010_27
- Last Update 05/19/2025
- File Size 0.2MB
- # of Slides 2
- File Format PPTX
- Slide Ratio 16:9
- Color
Keywords
- #Content-Based Slides
- #Design-Based Slides
- #Market and Competitor Analysis
- #Graph
- #Competitor Analysis
- #Market Analysis
- #Horizontal Bar
- #Horizontal Bar Chart
- #16:9
- #horizontal bar chart PowerPoint
- #bar graph slide template
- #data comparison chart
- #market analysis PowerPoint
- #competitor analysis slide
About the Product
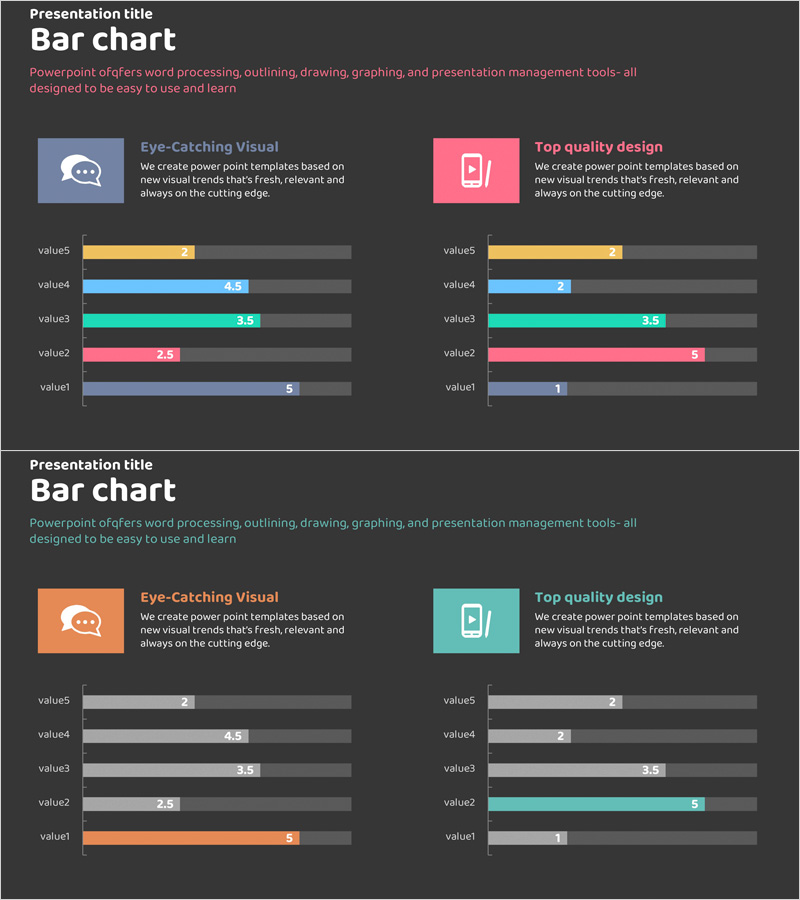
A horizontal bar chart PowerPoint slide optimized for market analysis and competitor comparison. This presentation template features 5 data items displayed across 4 color series (pink, teal, orange, and blue), enabling simultaneous numerical comparison in reports, presentations, and business decks. Each bar includes precise value labels and is fully editable, with 2 slides in 16:9 widescreen format ready for immediate use.
Usage Points
-
Main Usage
Visualize and compare multiple data items across categories—ideal for market analysis, competitor benchmarking, and performance metrics. The 4-color series design clearly differentiates category-level performance variations.
-
How to Use
Insert into the market overview or competitive analysis section of business reports, or use as a key metrics comparison slide in executive presentations. Edit the bar values and labels with your own data for immediate deployment.
-
Recommended For
Marketing plans, quarterly business reports, executive briefings, consulting proposals, and strategy presentations. Recommended for marketers, business analysts, consultants, and executives who need data-driven visual communication.
-
Slide Structure
2-slide deck with dual horizontal bar chart sections per slide. Displays 5 data items (value1–value5) across 4 color series (pink, teal, orange, blue). Includes value labels and legend for complete data clarity.
Related Products
-

Graph of Analysis of Transportation Use Status - Market Competition Analysis
#Market and Competitor Analysis #Graph #Competitor Analysis
-

Circular Highlight Bar Graph – Optimal for Market and Competitor Analysis
#Market and Competitor Analysis #Graph #Competitor Analysis
-

Blue Green Horizontal Bar Graph – Optimized for Market and Competitive Analysis
#Market and Competitor Analysis #Diagram #Graph
-

Competitor and Customer Analysis Horizontal Bar Graph and Table
#Market and Competitor Analysis #Diagram #Graph
