Age-based Market Share Analysis with Pie Chart
RJ0400030_11
- Last Update 05/25/2025
- File Size 8.7MB
- # of Slides 2
- File Format PPTX
- Slide Ratio 16:9
- Color
Keywords
About the Product
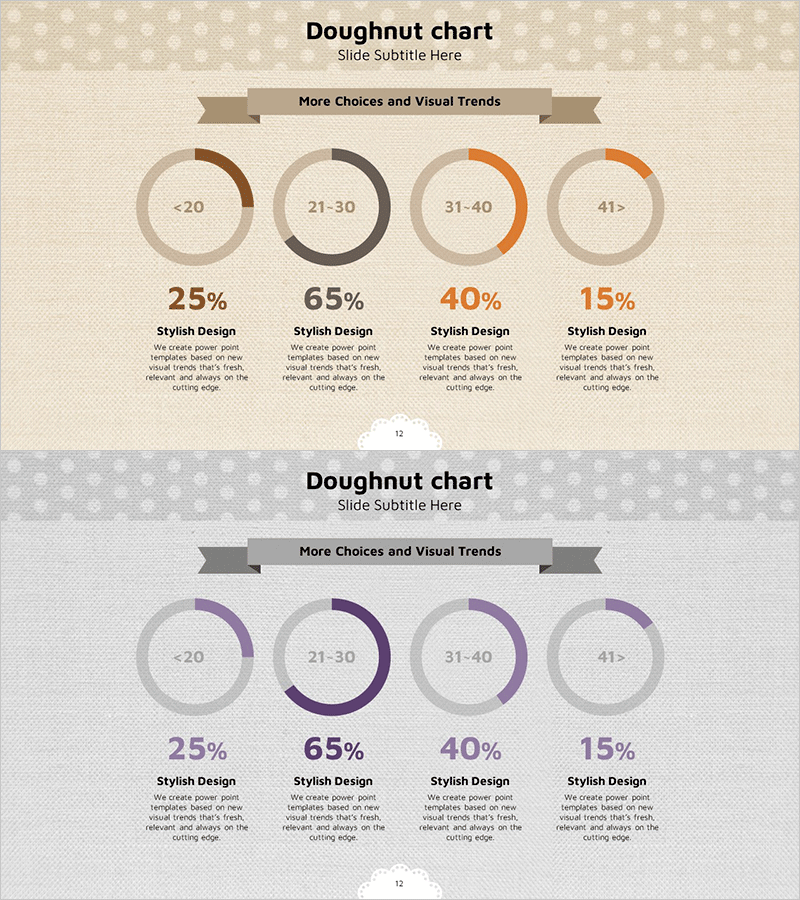
A 4-segment pie chart PowerPoint slide designed to visualize age-based market share distribution across four demographic groups. The slide features donut-style charts in brown, gray, orange, and beige tones on a beige dotted background, clearly representing market segments for under 20, 21-30, 31-40, and 41+ age groups with corresponding percentages. The 2-slide deck includes a primary color scheme and a purple-tone variation, both with descriptive text areas below each chart for adding market insights. The wide 16:9 format is optimized for modern presentation environments, and the PPTX format allows immediate customization of data values and text content.
Usage Points
-
Main Usage
Effectively visualizes proportional data across four demographic categories such as age groups, customer segments, or sales distribution. Ideal for market analysis sections in business plans, market research reports, and investor presentations where demographic breakdown is critical to strategy.
-
How to Use
Replace the percentage values with your actual market data, then add relevant insights or marketing strategies for each age segment in the text areas below. Color schemes can be adjusted to match corporate branding, and you can select between the two color variations based on your presentation tone and audience.
-
Recommended For
Marketing professionals, market analysts, business strategists, and sales managers presenting customer segmentation, market penetration by age group, or demographic sales performance. Suitable for investor pitch decks, quarterly earnings presentations, product launch strategy meetings, and market research briefings.
-
Slide Structure
Slide 1: Four donut-style charts in brown, gray, orange, and beige displaying 25%, 65%, 40%, and 15% segments respectively, with 'Stylish Design' labels and descriptive text areas. Slide 2: Identical layout with purple-tone color variation (purple, dark purple, light purple, beige). 16:9 widescreen format with beige dotted pattern background.
Related Products
-

Performance Analysis Pie Chart – Market Share Visualization
#Market and Competitor Analysis #Diagram #Graph
-

Analysis by Pie Chart Item – Visualizing Market Share
#Market and Competitor Analysis #Graph #Market Share
-

A Lively Green Orange Pie Chart
#Market and Competitor Analysis #Graph #Market Share
-

Market Analysis by Year Pie Chart – Emphasizing Market Share
#Market and Competitor Analysis #Graph #Market Share
