Competitor Comparison Donut Chart – Effective Tool for Market and Competitive Analysis
RB0300027_5
- Last Update 03/10/2025
- File Size 2.2MB
- # of Slides 2
- File Format PPTX
- Slide Ratio 4:3
- Color
Keywords
- #Content-Based Slides
- #Design-Based Slides
- #Market and Competitor Analysis
- #Graph
- #Competitor Analysis
- #Market Analysis
- #Circles
- #Doughnut Chart
- #4:3
- #donut chart PowerPoint
- #pie chart slide template
- #competitor analysis presentation
- #market comparison PPT
- #data visualization slides
- #donut graph template download
About the Product
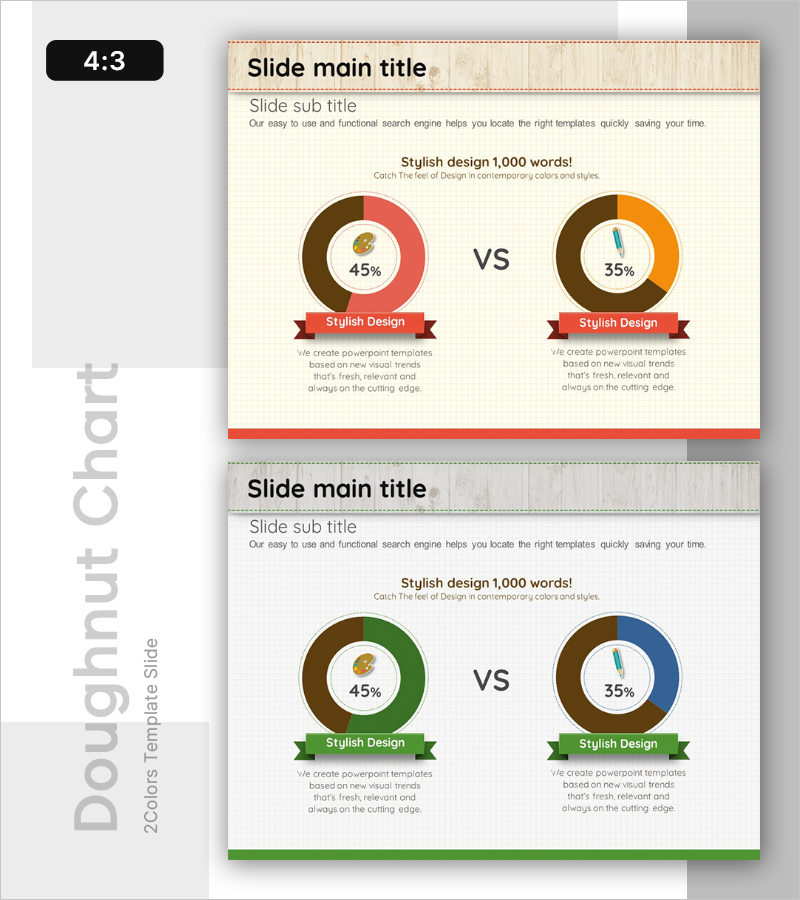
A professional donut chart PowerPoint slide set designed for market analysis and competitive comparison presentations. This 2-slide template features warm-toned color schemes in brown, red, and orange, with each slide displaying two donut charts side-by-side to compare up to four data items simultaneously. The center of each donut contains percentage values and icons, while a ribbon banner at the bottom displays titles, creating a clear information hierarchy. Provided in 4:3 aspect ratio PPTX format, all colors and numerical values are fully editable, allowing immediate integration into various business presentations and reports.
Usage Points
-
Main Usage
Ideal for presenting market share comparisons, competitive performance metrics, customer satisfaction survey results, and product preference analysis. The dual donut layout enables simultaneous comparison of two datasets, while centered percentages and icons emphasize key insights and capture audience attention.
-
How to Use
Customize the donut chart colors, percentage values, and ribbon banner text through the slide master to match your specific data. Duplicate slides as needed to add more comparison items, and arrange them according to your presentation flow and narrative structure.
-
Recommended For
Recommended for executive reports, business plans, marketing strategy presentations, investor pitch decks, market research reports, and competitive analysis presentations prepared by strategists, marketers, analysts, and business leaders.
-
Slide Structure
2-slide template with dual donut charts positioned side-by-side on each slide for comparative analysis. Center donut areas contain percentage values and icons; bottom ribbon banners provide title areas. Color palette includes brown, red, orange, green, and blue combinations for visual variety and professional appearance.
Related Products
-

Survey and Poll Analysis Graphs – Optimized for Market Analysis
#Market and Competitor Analysis #Diagram #Graph
-

Market Analysis Slide Using Donut Charts and Table
#Market and Competitor Analysis #Diagram #Graph
-

Visualizing Competitive Analysis with Table and 3 Donut Graphs
#Market and Competitor Analysis #Diagram #Graph
-

Medical Comparative Analysis Donut Circle Graph – Effective Market Analysis
#Market and Competitor Analysis #Graph #Competitor Analysis
