Donut Circle Graph & Cube Graph – Optimized for Market & Competitor Analysis
RJ0400035_13
- Last Update 05/26/2025
- File Size 5.4MB
- # of Slides 2
- File Format PPTX
- Slide Ratio 16:9
- Color
Keywords
- #Content-Based Slides
- #Design-Based Slides
- #Market and Competitor Analysis
- #Graph
- #Other
- #Competitor Analysis
- #Market Analysis
- #Circles
- #Doughnut Chart
- #16:9
- #donut pie chart PowerPoint slide
- #donut chart template download
- #market analysis PowerPoint
- #competitor comparison slide
- #how to create pie chart in PowerPoint
About the Product
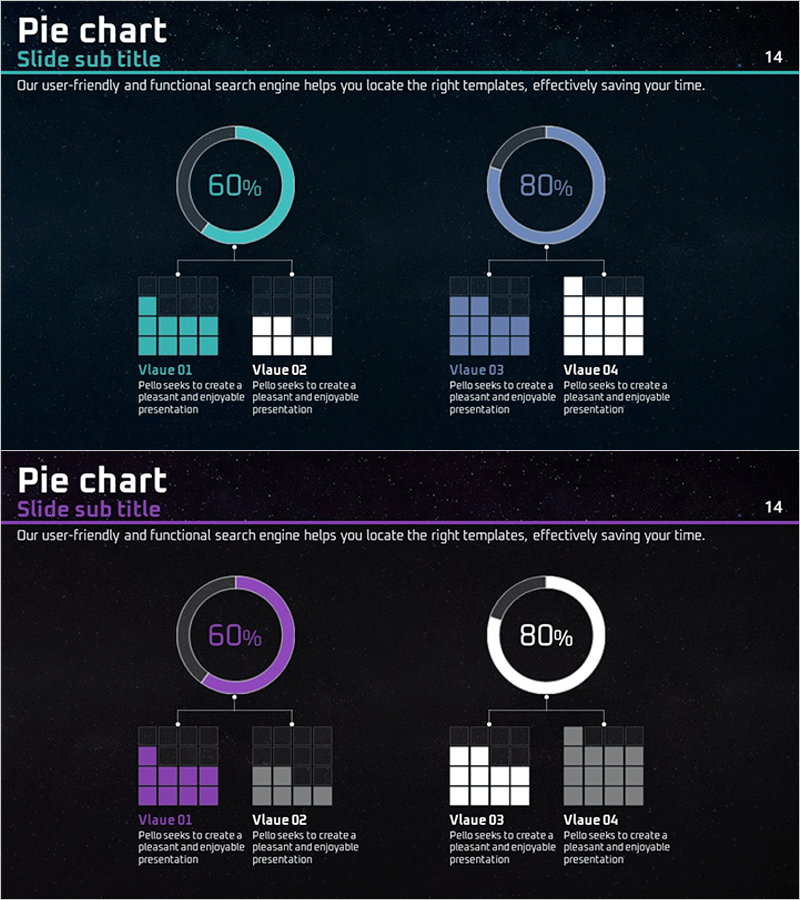
A professional PowerPoint slide template optimized for market analysis and competitor comparison. Features two donut charts in cyan and purple tones on a dark background, each paired with four cube graphs below for detailed data breakdown. The 16:9 widescreen format includes 2 slides that enable simultaneous visualization of percentage distribution and comparative metrics. Ready-to-use for business presentations, reports, and strategic analysis decks.
Usage Points
-
Main Usage
Visualizes dual datasets such as market share, competitor positioning, customer demographics, or revenue distribution. The donut chart's center space highlights key metrics, while cube graphs below provide granular item-by-item comparison and ranking.
-
How to Use
Input your data into the donut chart segments and adjust cube graph heights and colors to represent comparative values. Modify chart labels, legends, and background colors as needed for your presentation context. All elements are fully editable in PowerPoint.
-
Recommended For
Executive dashboards, marketing strategy presentations, business analysis reports, consulting proposals, quarterly performance reviews, and competitive intelligence briefings. Ideal for data-driven decision-making environments.
-
Slide Structure
Slide 1: Cyan donut chart (60% display) with 4 cube graphs in dual-color arrangement / Slide 2: Purple donut chart (80% display) with 4 cube graphs in dual-color arrangement. Each slide pairs a prominent donut chart with two sets of comparative cube visualizations.
Related Products
-

Petcare Area Chart – Visualizing Market Analysis
#Market and Competitor Analysis #Graph #Other
-

Survey and Poll Analysis Graphs – Optimized for Market Analysis
#Market and Competitor Analysis #Diagram #Graph
-

Regional Demand Survey Graph – Key to Market Analysis
#Market and Competitor Analysis #Financial Plans and Performance #Graph
-

Contribution-Based Performance Chart – Infographic for Market Analysis
#Market and Competitor Analysis #Graph #Competitor Analysis
