Annual Growth Trends in Child Development
RB0300008_5
- Last Update 03/09/2025
- File Size 0.3MB
- # of Slides 2
- File Format PPTX
- Slide Ratio 4:3
- Color
Keywords
About the Product
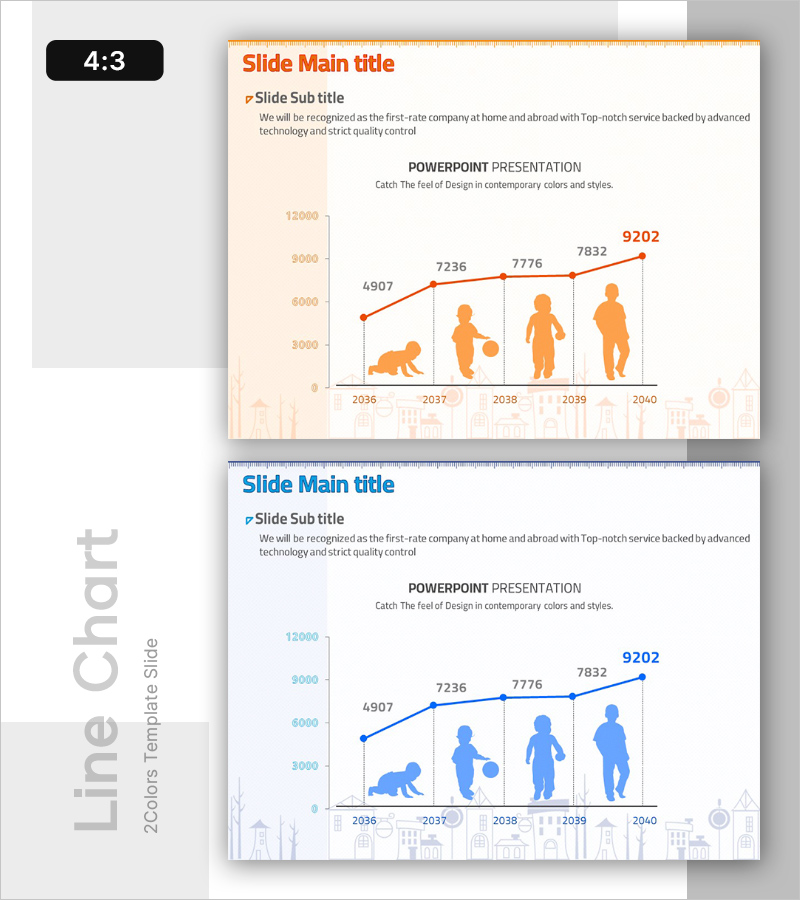
A line chart PowerPoint slide visualizing annual child development growth trends from 2036 to 2040. The slide features five data points (4907, 7236, 7776, 7832, 9202) connected by an orange trend line, with silhouette icons representing developmental stages beneath each year marker. Presented in 4:3 aspect ratio with 2 slides offering identical layouts in two color versions—orange and blue—allowing flexible integration into any presentation theme. The background includes a subtle cityscape illustration, making it ideal for market analysis, competitive analysis, and demographic reports.
Usage Points
-
Main Usage
Effectively visualizes year-over-year growth trends and change patterns using a line chart format. Ideal for presenting child development milestones, market size evolution, user growth trajectories, and other numerical changes over time in a clear, intuitive manner.
-
How to Use
Insert into business plans, market analysis reports, or competitive analysis documents within the data visualization section. The slide comes pre-formatted with icons and value labels, requiring only data modification for immediate use. Choose between orange or blue color versions to match your presentation's brand identity.
-
Recommended For
Marketing professionals, business analysts, planners, educators, and data presenters who need to communicate time-series trends persuasively. Particularly effective for demographic statistics, market growth rates, product sales trends, and user acquisition metrics.
-
Slide Structure
The line chart features a Y-axis scale (0–12,000) and X-axis timeline (2036–2040) with five connected data points forming an upward trend. Orange silhouette icons representing developmental stages are positioned below each year label. A cityscape pattern background provides visual context without overwhelming the data presentation.
Related Products
-

Divorce Count Graph – Future Trends Analysis
#Market and Competitor Analysis #Graph #Future Outlook
-

Eco-friendly Business Future Outlook Line Graph – Market Analysis
#Market and Competitor Analysis #Graph #Future Outlook
-

Line Chart of Notepad Frame – Market and Competitor Analysis
#Market and Competitor Analysis #Graph #Future Outlook
-

Purple Turquoise Line Chart – Market Analysis and Future Outlook
#Market and Competitor Analysis #Graph #Future Outlook
