Line Charts for Design Tasks – Market and Competitor Analysis
RJ0900006_18
- Last Update 08/17/2025
- File Size 0.1MB
- # of Slides 2
- File Format PPTX
- Slide Ratio 16:9
- Color
Keywords
- #Content-Based Slides
- #Design-Based Slides
- #Market and Competitor Analysis
- #Graph
- #Future Outlook
- #Market Analysis
- #Line
- #Line Chart
- #16:9
- #line chart PowerPoint
- #market analysis slide
- #competitor analysis presentation
- #trend graph template
- #data visualization PowerPoint
- #dual-series line chart download
About the Product
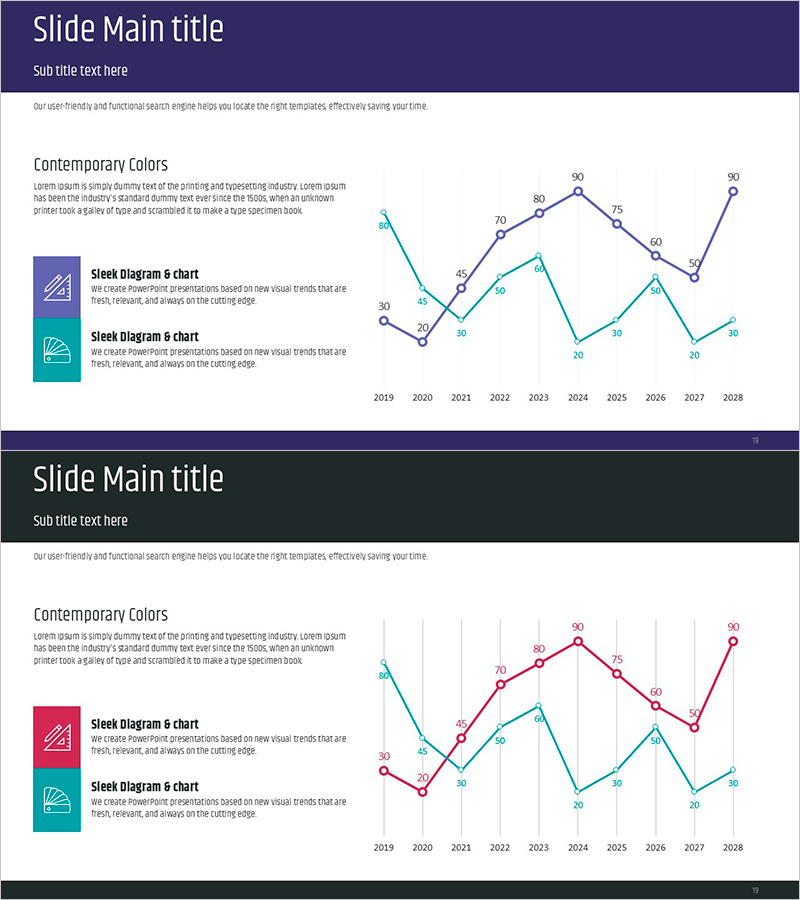
A dual-series line chart PowerPoint slide designed for market and competitor analysis presentations. This template visualizes 10-year data trends from 2019 to 2028 using two distinct trend lines in navy blue and teal, each labeled with data values. The slide layout features a header section with title and descriptive text, left-aligned legend icons, and a spacious chart area. Ideal for business reports, marketing strategy presentations, and investor pitches where comparative trend analysis is essential. Fully editable and ready for immediate use in professional presentations.
Usage Points
-
Main Usage
This slide effectively compares two independent data series over time, showing market trends and competitive performance simultaneously. The dual-line format with labeled data points enables clear visualization of performance variations and trend patterns across a 10-year period.
-
How to Use
Insert this slide into business reports, market analysis sections, competitive intelligence presentations, and investor pitch decks. Replace sample data with your actual figures, adjust colors if needed, and customize the header text to match your presentation context. The template is fully editable in PowerPoint for seamless integration.
-
Recommended For
Marketing managers, business analysts, financial planners, management consultants, and strategy professionals. Particularly effective for presentations requiring market trend comparison, competitive benchmarking, performance tracking, and data-driven decision-making narratives.
-
Slide Structure
Two-slide set with consistent layout: header section (title and subtitle), left legend area (two icon indicators), and right chart area. Each line chart displays 10 data points (2019–2028) on the X-axis, numerical scale on Y-axis, and two color-coded series (navy blue and teal) with value labels at each point.
Related Products
-

Commuting Public Transportation Status Graph – Market Analysis and Outlook
#Market and Competitor Analysis #Graph #Future Outlook
-

Purple Turquoise Line Chart – Market Analysis and Future Outlook
#Market and Competitor Analysis #Graph #Future Outlook
-

Line Graph Market Research by Year – Market Trend Analysis
#Market and Competitor Analysis #Graph #Future Outlook
-

Eco-friendly Business Future Outlook Line Graph – Market Analysis
#Market and Competitor Analysis #Graph #Future Outlook
