Commuting Public Transportation Status Graph – Market Analysis and Outlook
RJ0900022_10
- Last Update 08/22/2025
- File Size 3.9MB
- # of Slides 2
- File Format PPTX
- Slide Ratio 16:9
- Color
Keywords
About the Product
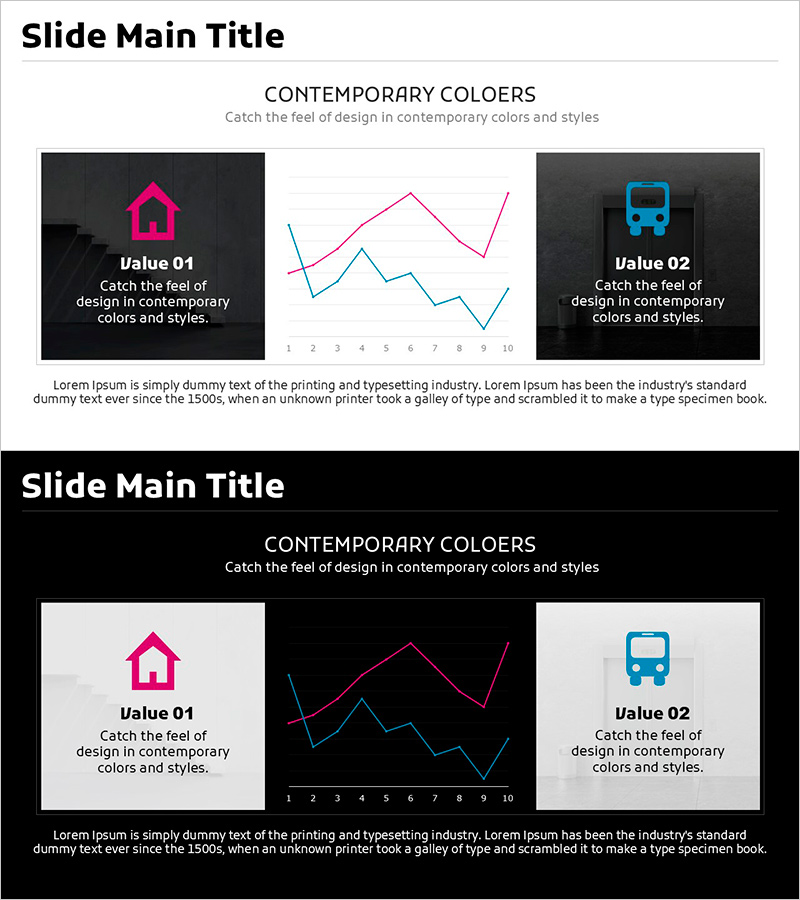
A 2-slide line graph PowerPoint template visualizing commuting public transportation trends with dual-series data comparison. Dark gray background with pink and blue line series showing time-based changes across 10 data points. Each slide features icon-labeled sections (house, bus) with text boxes for Value 01 and Value 02 categories. Ideal for market analysis presentations, demand forecasting, performance benchmarking, and strategic planning decks that require clear trend visualization.
Usage Points
-
Main Usage
Compare two or more data series across time periods or categories to highlight trend changes. Suitable for transportation usage analysis, quarterly revenue trends, competitive performance benchmarking, and any presentation requiring multi-series trend visualization.
-
How to Use
Dark gray background with pink and blue line series representing two data sets. Left and right sections contain icon-labeled text boxes for category names. Replace graph data points (1-10 scale) with your actual values. Adjust X-axis labels and Y-axis range to match your dataset. All elements are fully editable in PowerPoint.
-
Recommended For
Marketing reports, sales presentations, market analysis briefings, business performance reviews, financial forecasting, and strategic planning meetings. Recommended for industries requiring time-series analysis: finance, retail, transportation, telecommunications, and consulting.
-
Slide Structure
2-slide deck with 3-column layout: left dark box (icon + text), center line graph (2 series, 1-10 X-axis scale), right dark box (icon + text). 16:9 widescreen format, PPTX file. All chart elements, text, and icons are fully customizable.
Related Products
-

Line Charts for Design Tasks – Market and Competitor Analysis
#Market and Competitor Analysis #Graph #Future Outlook
-

Future Technology Industry Analysis Graph – Market Trends and Growth Prediction
#Market and Competitor Analysis #Diagram #Graph
-

Purple Turquoise Line Chart – Market Analysis and Future Outlook
#Market and Competitor Analysis #Graph #Future Outlook
-

Annual Growth Trends in Child Development
#Market and Competitor Analysis #Graph #Future Outlook
