5-Year Real Estate Volume Chart – Market Analysis
RJ0900010_19
- Last Update 08/18/2025
- File Size 0.4MB
- # of Slides 2
- File Format PPTX
- Slide Ratio 16:9
- Color
Keywords
- #Content-Based Slides
- #Design-Based Slides
- #Market and Competitor Analysis
- #Graph
- #Market Analysis
- #Industry Trends
- #Column
- #Segmented Column
- #16:9
- #horizontal bar chart PowerPoint
- #stacked bar graph template
- #real estate market analysis slide
- #transaction volume data visualization
- #5-year trend chart PPT
- #real estate presentation template download
About the Product
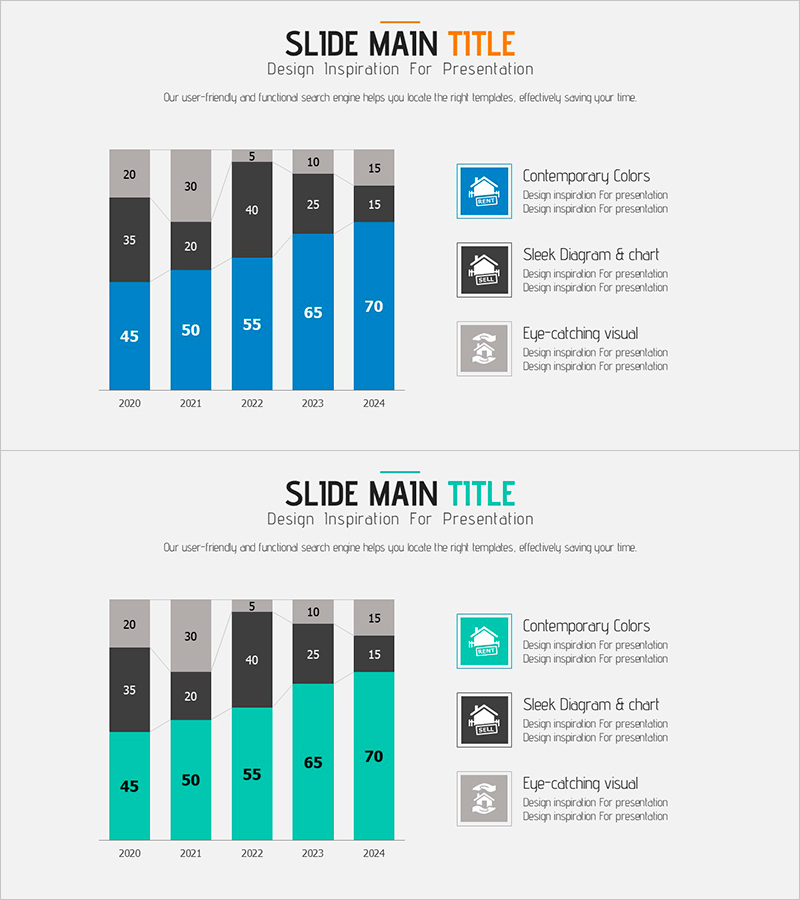
A horizontal stacked bar chart PowerPoint slide designed to visualize real estate transaction volume trends from 2020 to 2024. The data is represented in three-tier accumulation using blue, gray, and black colors, enabling clear comparison of annual transaction volumes and compositional ratios at a glance. This presentation slide is ideal for real estate market analysis reports, investment pitch decks, marketing strategy presentations, and data-driven business decision-making. The 2-slide set offers color variations in blue and teal tones, allowing customization to match your corporate branding and presentation style.
Usage Points
-
Main Usage
Clearly visualize year-over-year real estate transaction volume changes and compositional ratios to support market trend analysis and investment decision-making. The stacked bar structure simultaneously displays overall market scale and individual segment proportions, enhancing credibility in data-driven presentations.
-
How to Use
Insert into the market overview section of real estate market analysis reports, market opportunity slides in investment pitch decks, or market analysis pages in marketing strategy presentations. Easily customize by inputting your own data and adjusting bar heights and colors to represent various time-series datasets.
-
Recommended For
Real estate developers, property brokers, investment firms, market analysts, financial institution professionals, and real estate students preparing market trend presentations, investment analyses, and business plans.
-
Slide Structure
2-slide set featuring blue and teal color variations. Each slide contains a horizontal bar chart for 5 years (2020–2024), with each year's bar divided into three segments: blue (primary transaction volume), gray (secondary volume), and black (other volume) in cumulative stacked format.
Related Products
-

Trend of Market Share by Suit Product – Effective Graph for Market Analysis
#Market and Competitor Analysis #Graph #Market Analysis
-

3D Segmented Bar Graph for Performance Analysis – Market Trends
#Market and Competitor Analysis #Graph #Customer Analysis
-

Market Trends and Analysis Green Navy – Clearly Displaying Market Trends
#Market and Competitor Analysis #Graph #Market Analysis
-

Pork Consumption Stack Chart – Market Trend Analysis
#Market and Competitor Analysis #Graph #Market Analysis
