Cloud Service Development Graph
RB0200023_5
- Last Update 03/09/2025
- File Size 0.4MB
- # of Slides 2
- File Format PPTX
- Slide Ratio 4:3
- Color
Keywords
- #Content-Based Slides
- #Design-Based Slides
- #Product/Service Introduction
- #Market and Competitor Analysis
- #Graph
- #Development Status
- #Market Share
- #Circles
- #Doughnut Chart
- #4:3
- #doughnut chart PowerPoint slide
- #donut chart template
- #cloud service graph
- #multi-series pie chart
- #percentage visualization PowerPoint
- #concentric doughnut diagram
About the Product
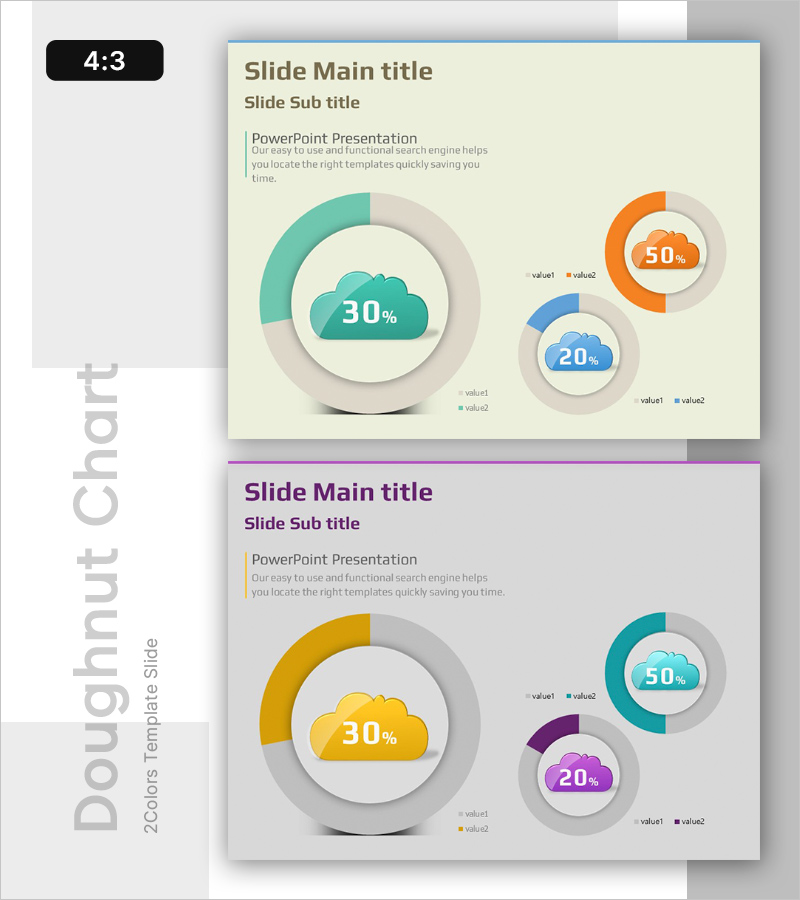
A doughnut chart PowerPoint slide designed to visualize cloud service development status and market share distribution. The slide features a central cloud icon surrounded by three concentric doughnut charts in teal, orange, blue, and purple colors to distinguish each data series. The 2-slide set provides two color variations so you can match your presentation theme. Each doughnut chart clearly displays percentage data with legends for easy interpretation. This presentation template is ready to use for cloud technology reports, IT service overviews, and development status presentations with immediate customization.
Usage Points
-
Main Usage
This slide effectively compares and emphasizes market share, development status, and service distribution for cloud technology and IT services. The central cloud icon clarifies the topic, while three concentric doughnut charts represent hierarchical data structures with visual clarity and professional appearance.
-
How to Use
Use this slide in IT company earnings presentations, cloud service marketing decks, technology status reports, and market analysis sections. Simply edit the colors and percentages in each doughnut to match your data. The 4:3 aspect ratio ensures compatibility with all standard presentation displays.
-
Recommended For
Ideal for IT and cloud service company executives, marketing teams, technology managers, startup pitch decks, tech conference presentations, and market research reports. Perfect for any business presentation requiring intuitive visualization of complex multi-series data.
-
Slide Structure
Slide 1: Three concentric doughnut charts in teal, orange, and blue with central cloud icon, displaying 30%, 50%, and 20% values with legend. Slide 2: Identical layout with color variation (orange, teal, purple). Both slides in 4:3 ratio, PPTX format, fully editable for text, numbers, and colors.
Related Products
-

Analysis graph of market share progress
#Product/Service Introduction #Market and Competitor Analysis #Graph
-

Space Exploration Donut Pie Chart
#Product/Service Introduction #Market and Competitor Analysis #Graph
-

Financial Business Analysis Pie Chart – Market Share Insights
#Product/Service Introduction #Market and Competitor Analysis #Graph
-

Business Idea Development Status Graph – Ideas and Growth
#Product/Service Introduction #Market and Competitor Analysis #Graph
