Cloud Process Structure – Diagram for Operational Planning
RB0200015-1_5
- Last Update 03/08/2025
- File Size 1.2MB
- # of Slides 2
- File Format PPTX
- Slide Ratio 4:3
- Color
Keywords
About the Product
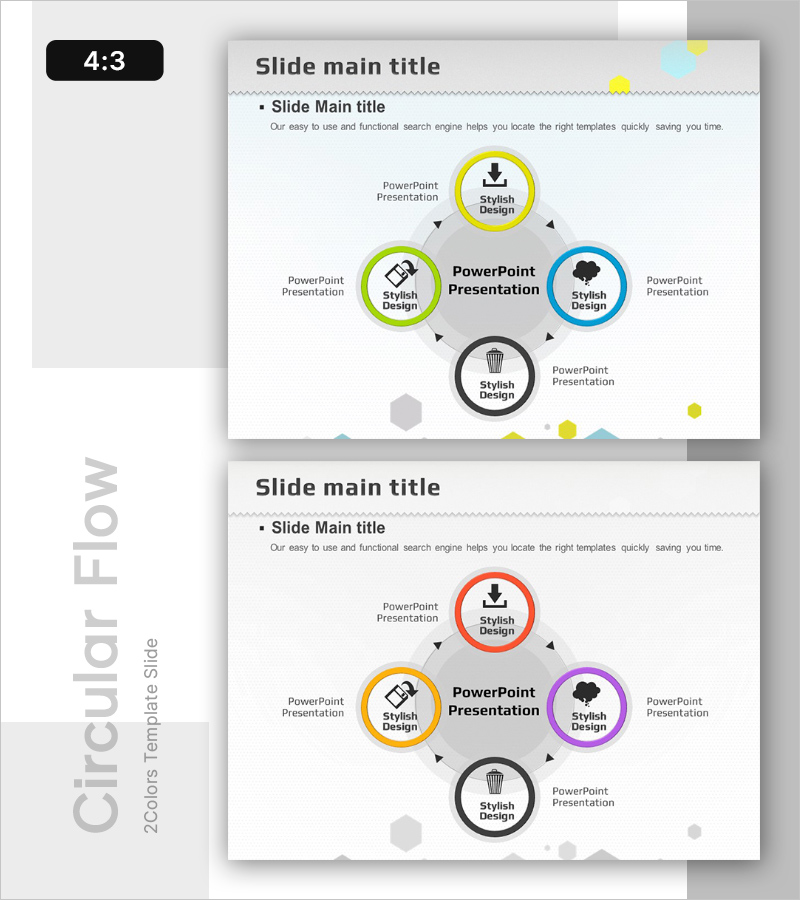
A PowerPoint slide that visualizes cloud-based operational processes using a 5-node circular structure. The diagram features a central hub with five connected nodes arranged in a circular pattern, each distinguished by download, palette, cloud, and trash can icons. Directional arrows between nodes clearly represent the process flow, while five distinct colors—yellow, green, blue, black, and purple—provide visual differentiation for each node. The 4:3 aspect ratio with 2-slide composition is ready for immediate use in operational planning, system architecture, and business process presentations.
Usage Points
-
Main Usage
Visualizes cloud-based operational processes in a circular structure to help team members understand system workflows intuitively. Clearly communicates the role and interconnection of each stage, enhancing process comprehension during operational planning presentations.
-
How to Use
Use in operational planning presentations, system architecture explanations, and business process training materials. Edit node text labels to match your actual workflow stages, and customize icons to align with your organization's branding if needed.
-
Recommended For
IT and cloud service companies, operations teams, system engineers, project managers, and technical documentation specialists who need to explain processes and create training materials.
-
Slide Structure
Center-focused layout with 5 nodes arranged in circular formation. Each node features a colored circular border (yellow, green, blue, black, purple) containing icons and text areas. Directional arrows indicate clockwise process flow. 2-slide composition allows flexible process representation.
Related Products
-

Agricultural Aftercare and Maintenance Strategy Circular Icon
#Operational Plan #Diagram #Production and Technology Development Strategy
-

Maple Leaf Circulation Work Process Slide - Core of Business
#Operational Plan #Diagram #Business Processes
-

Camping Product Quality Assurance Plan Slide
#Operational Plan #Diagram #Business Processes
-

Business Process Pentagon 3D Diagram – Visualizing Operational Plans
#Operational Plan #Technical Approach #Diagram
