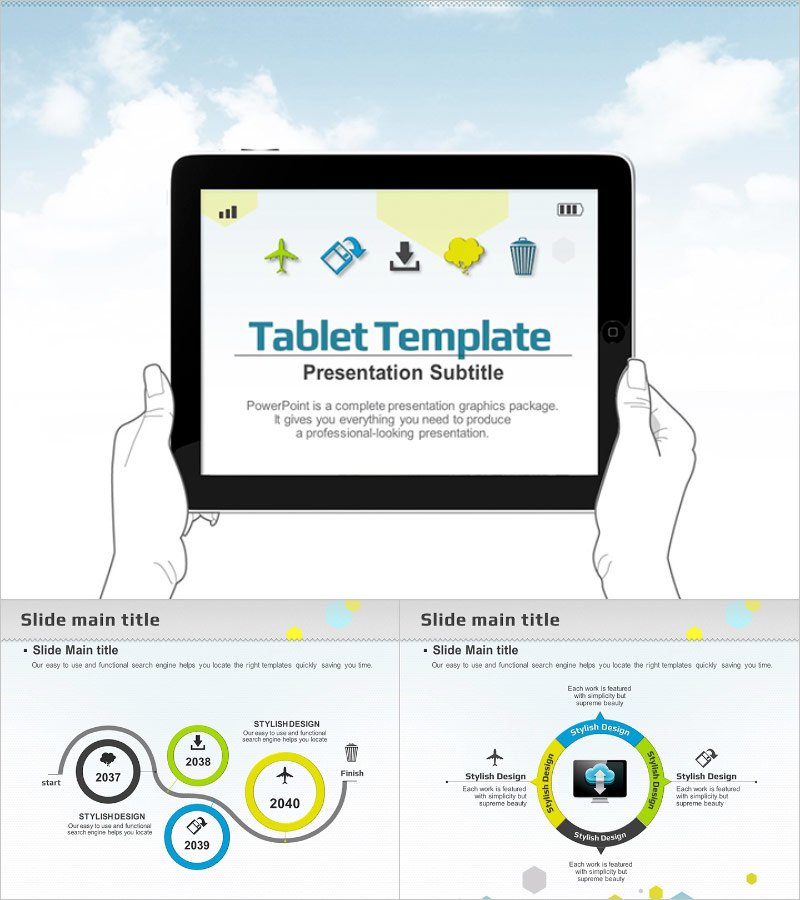
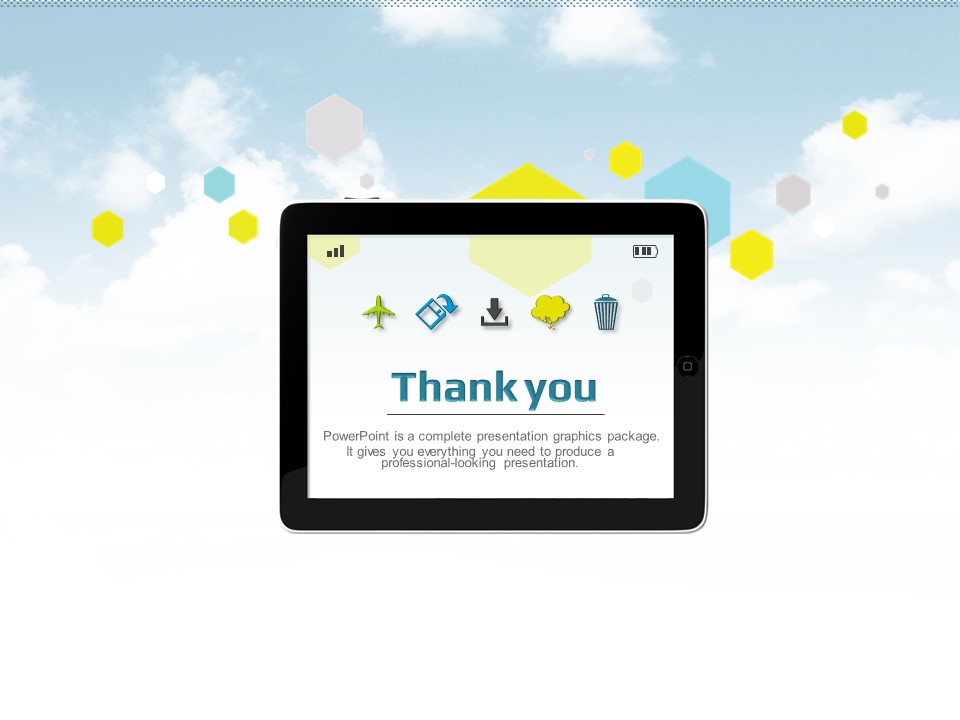
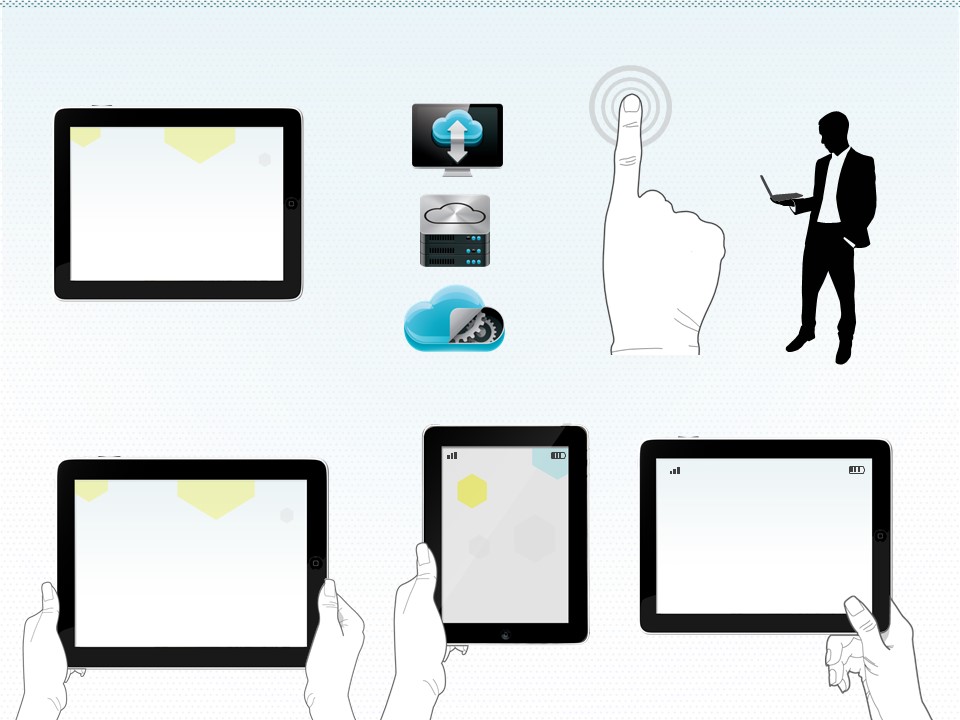
Tablet Illustration PowerPoint Template – Modern and Elegant Design
B0200015-1
- Last Update 01/01/2025
- File Size 4.8MB
- # of Slides 36
- File Format PPTX
- Slide Ratio 4:3
- Color
Slide Preview

Keywords
About the Product
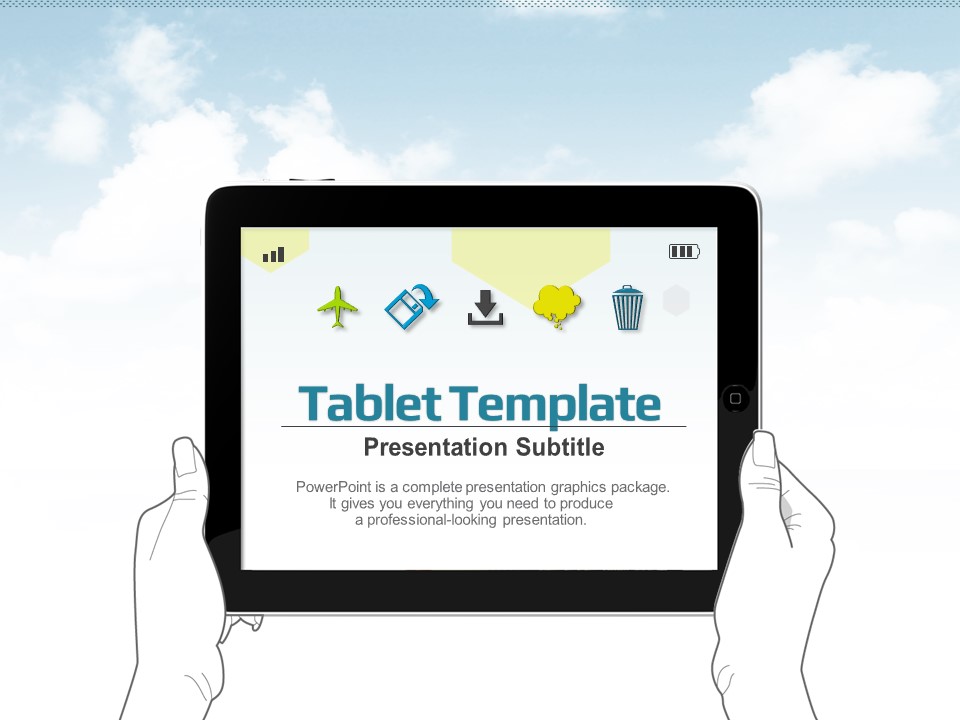
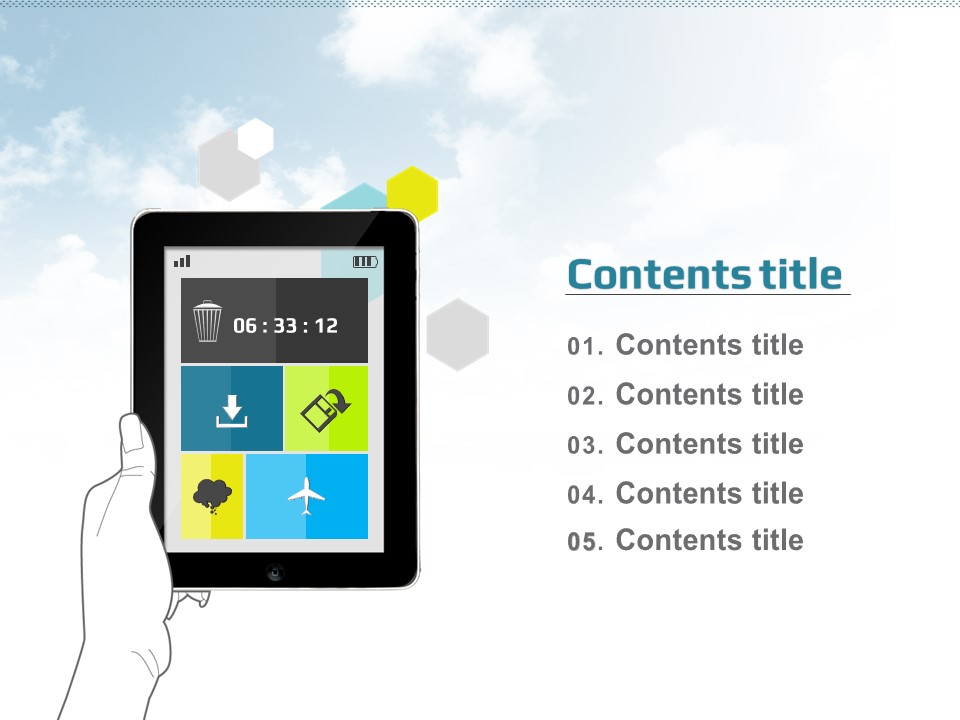
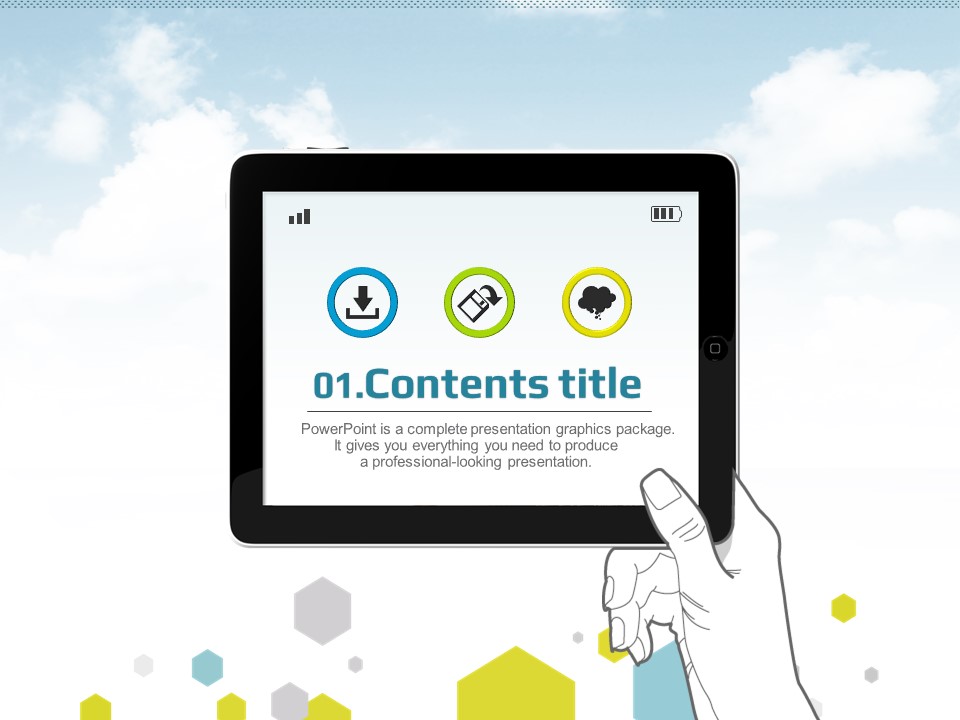
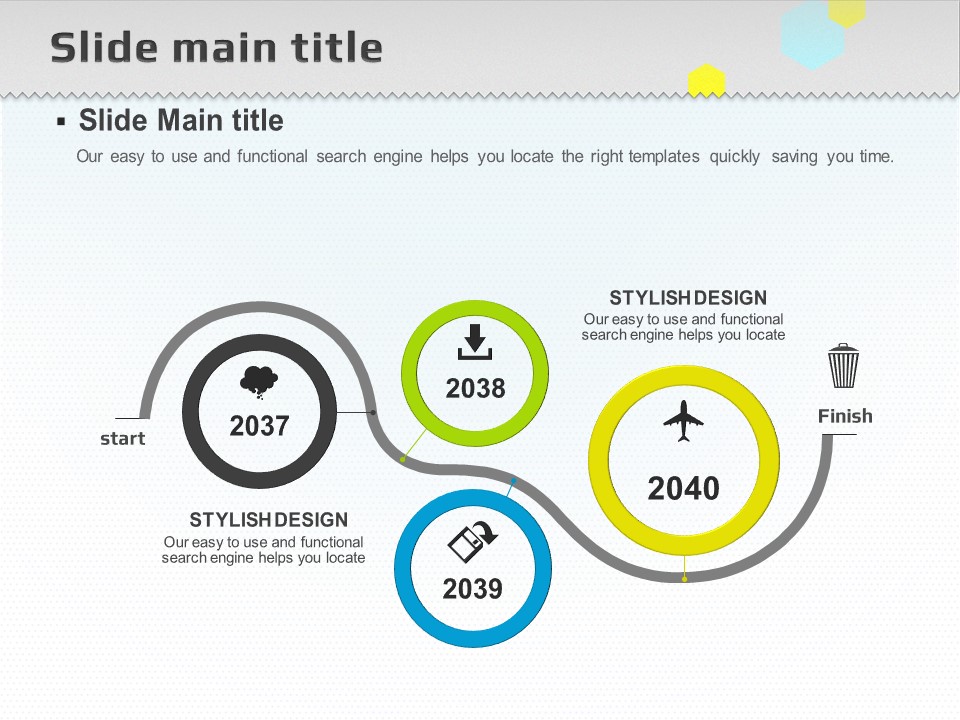
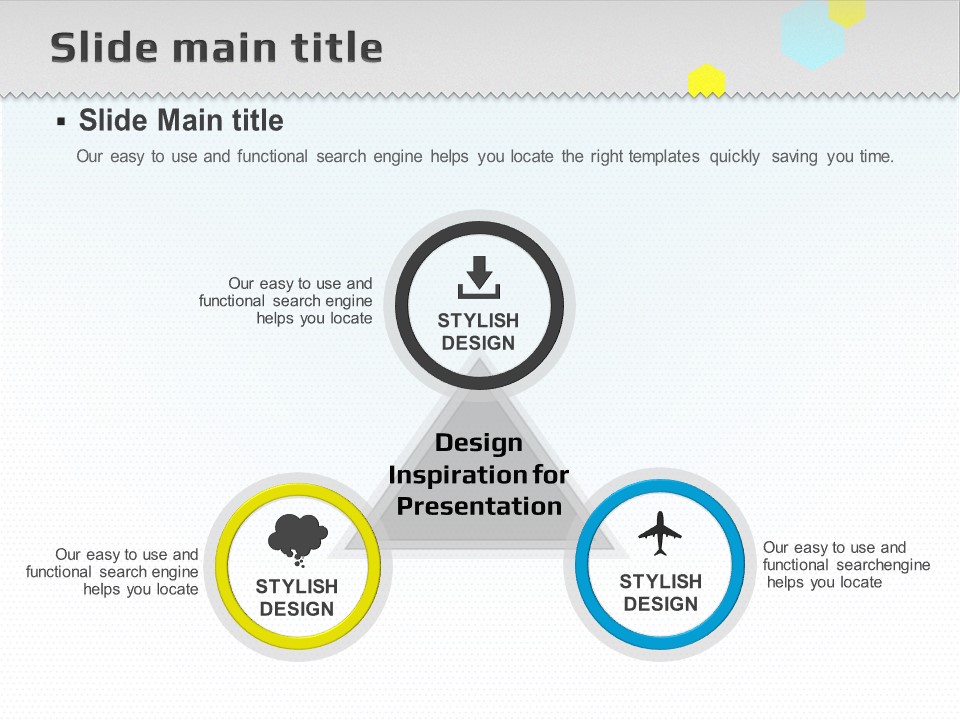
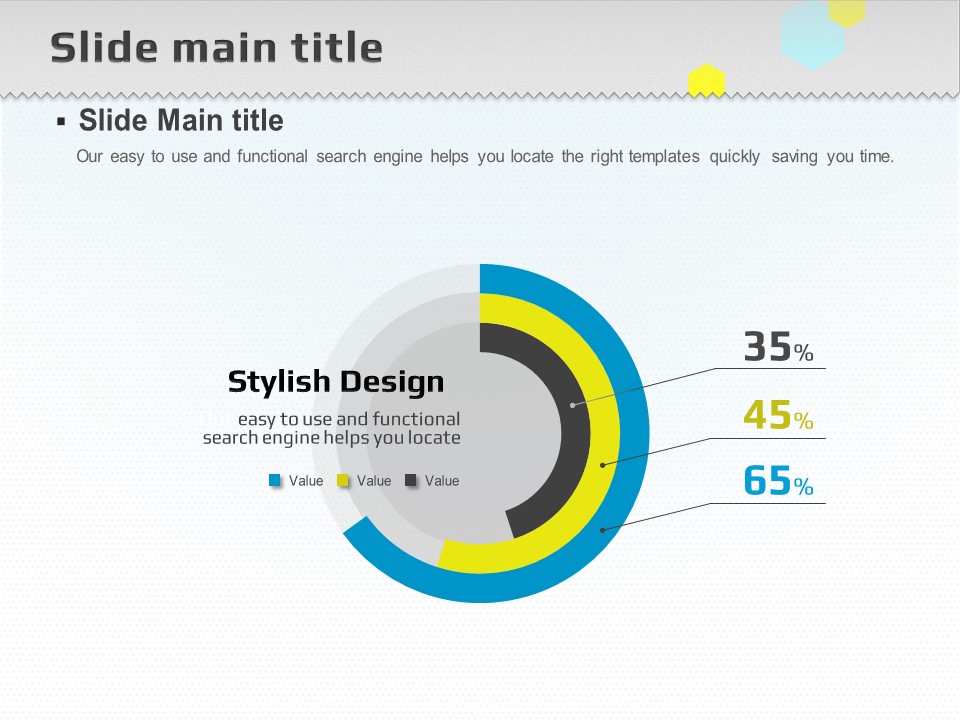
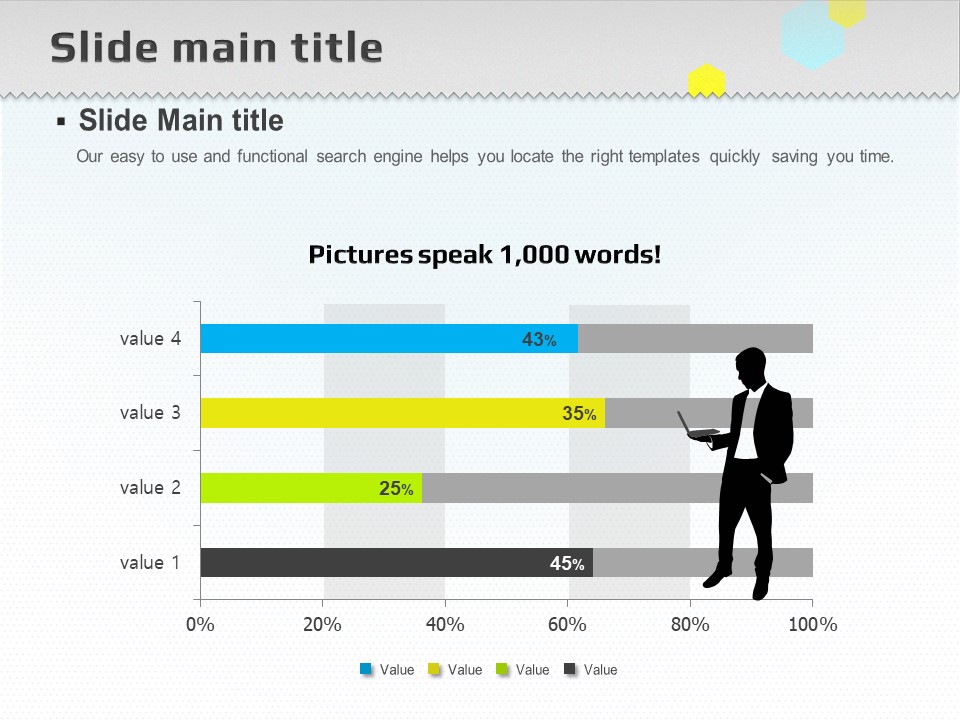
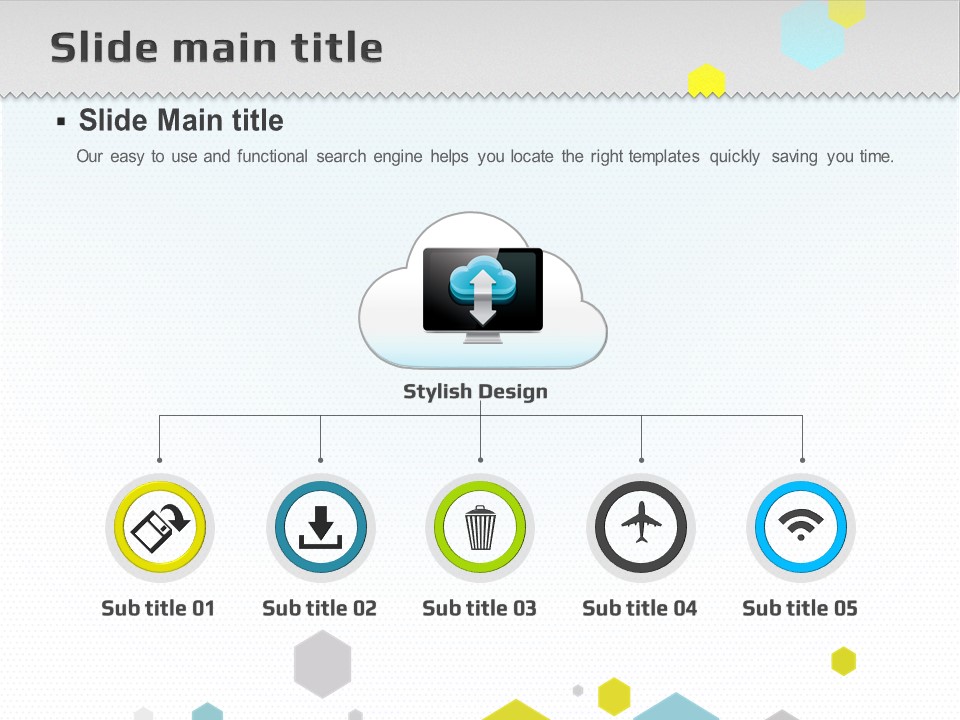
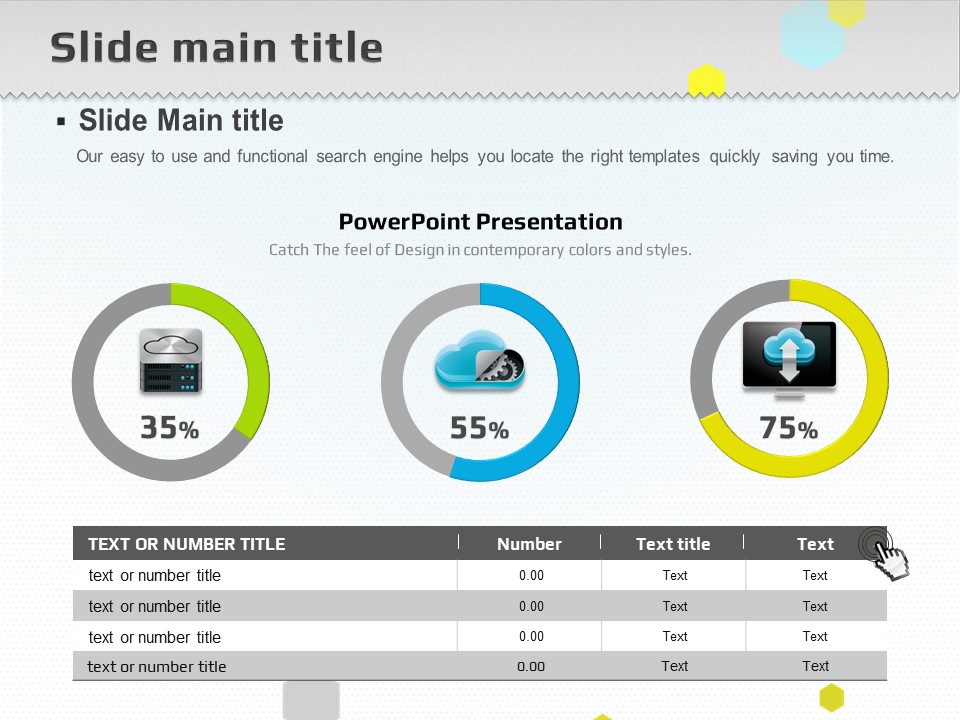
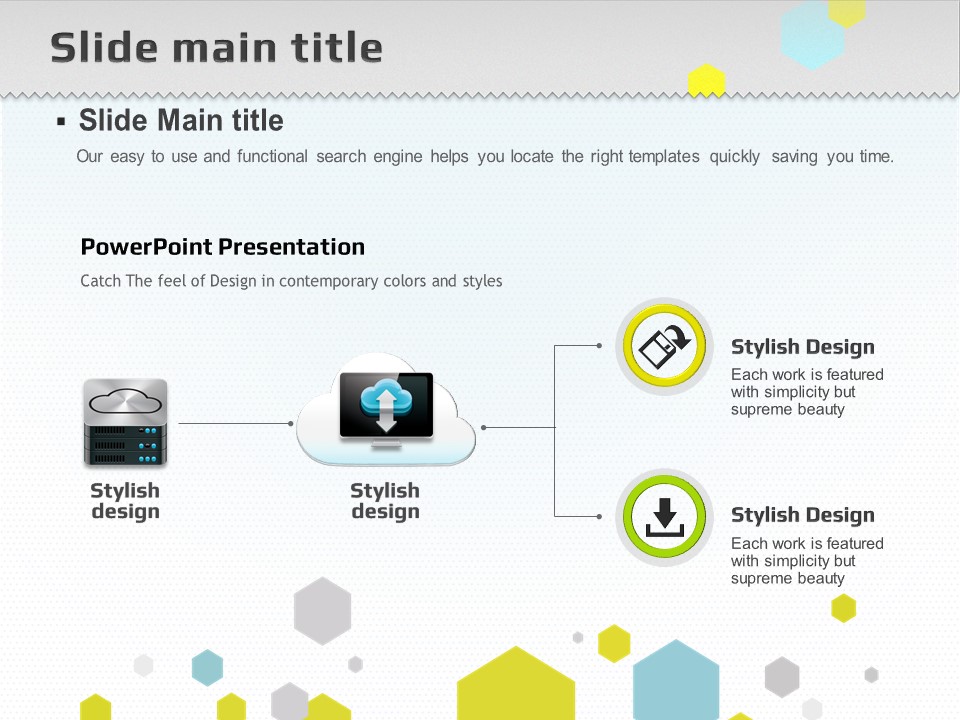
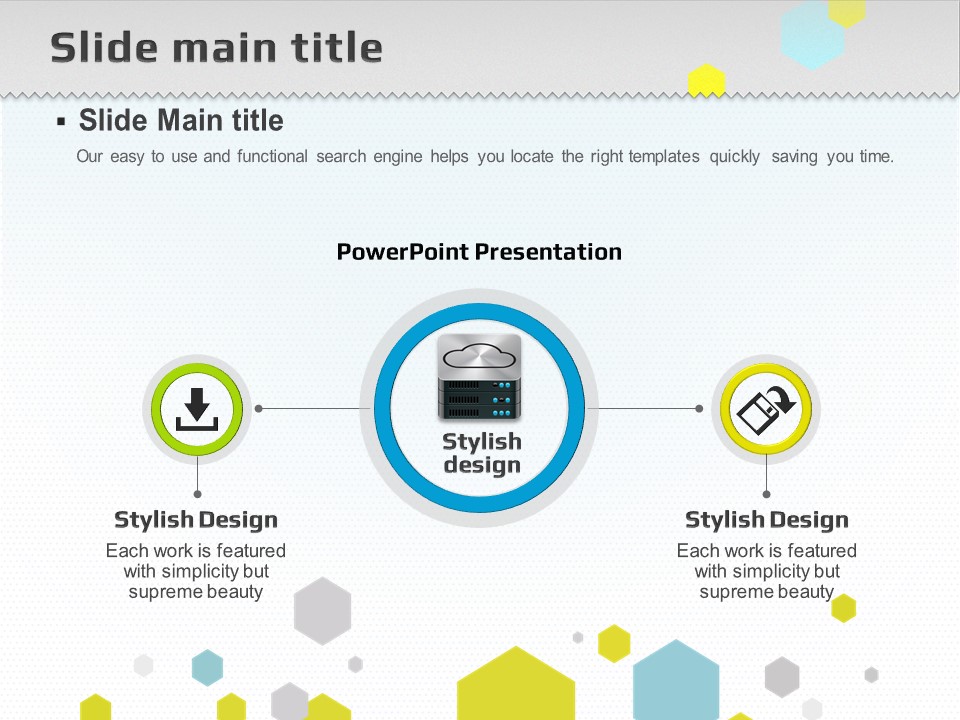
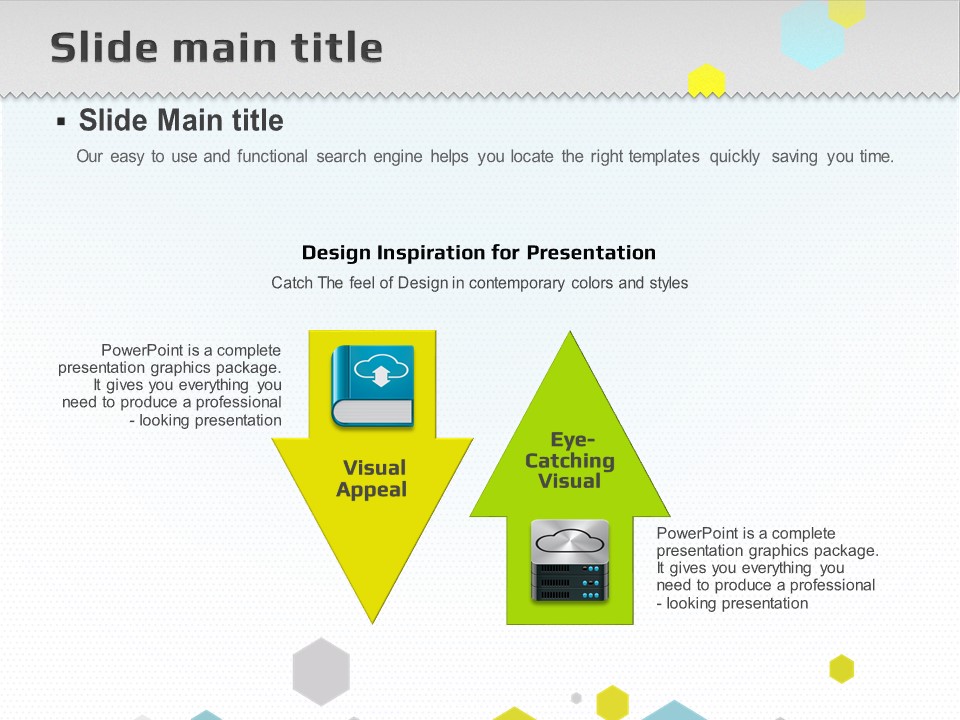
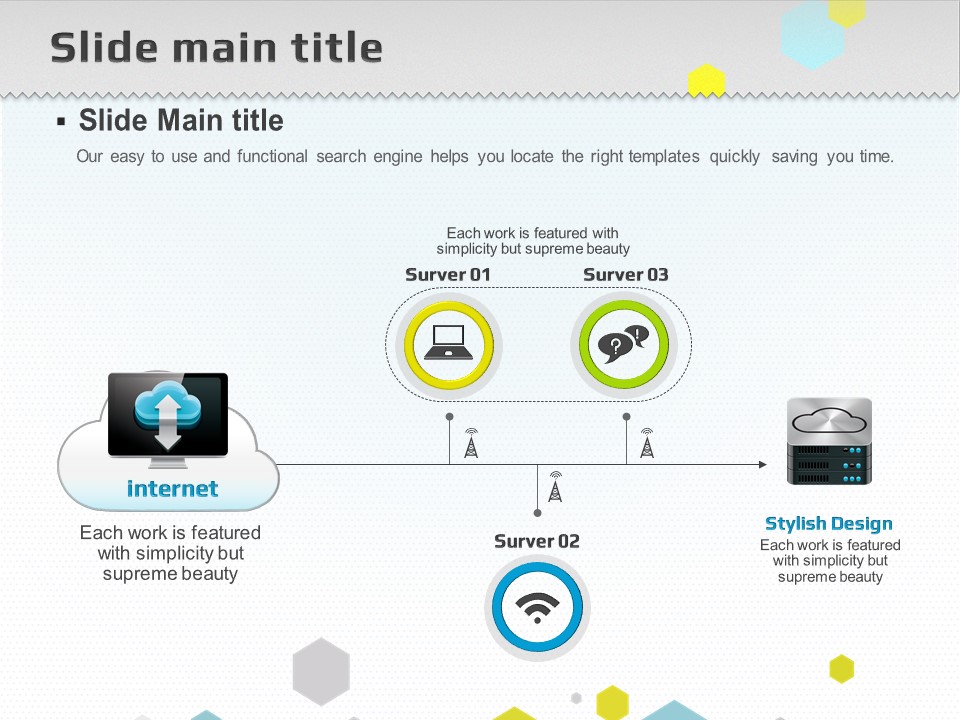
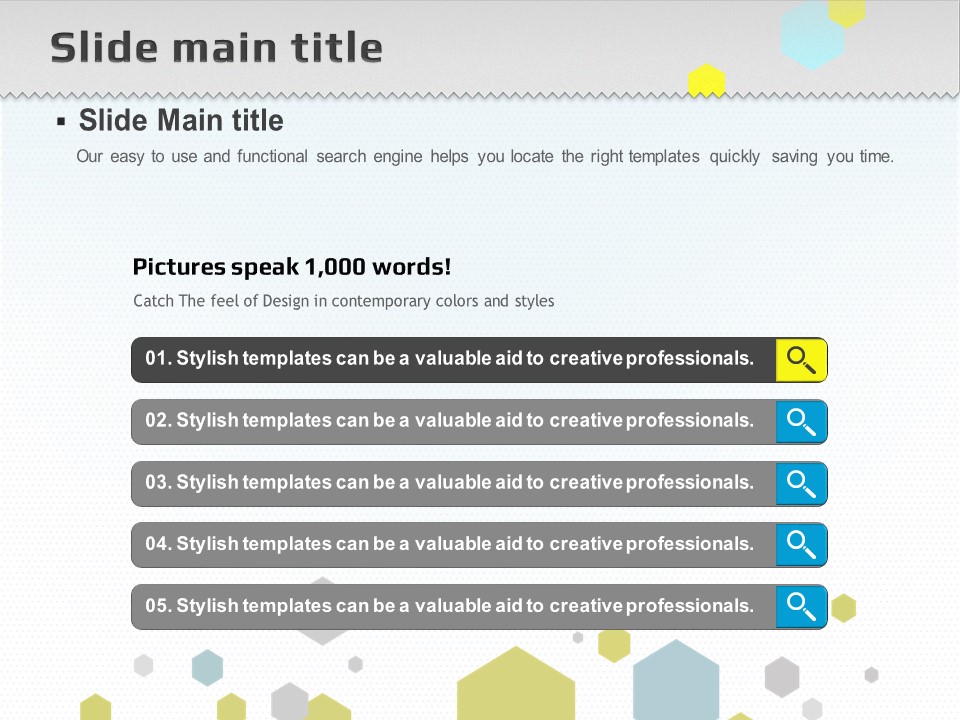
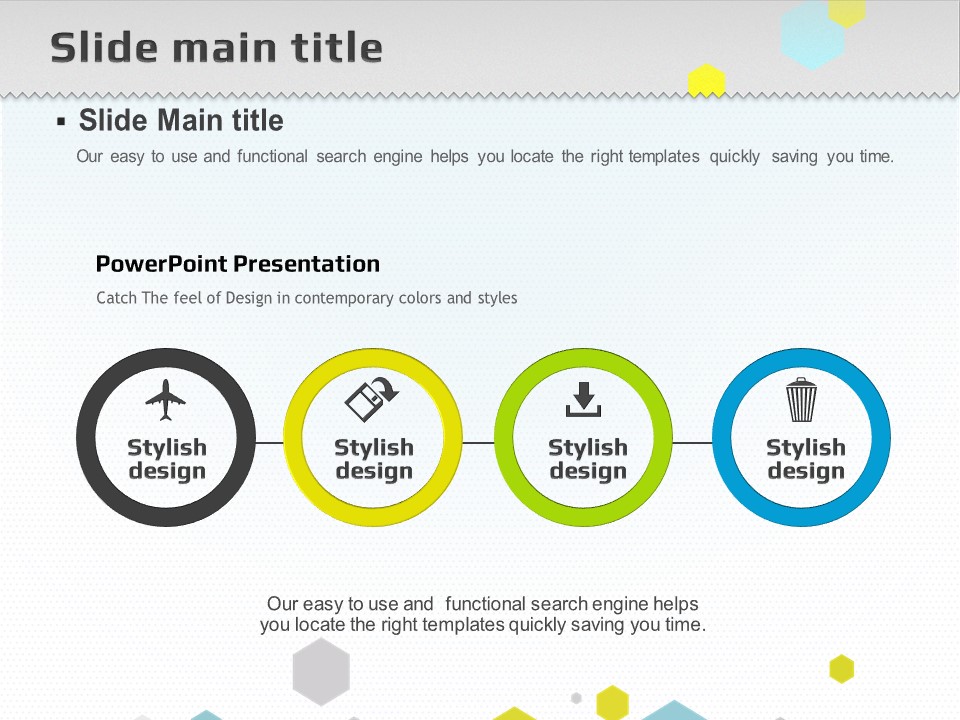
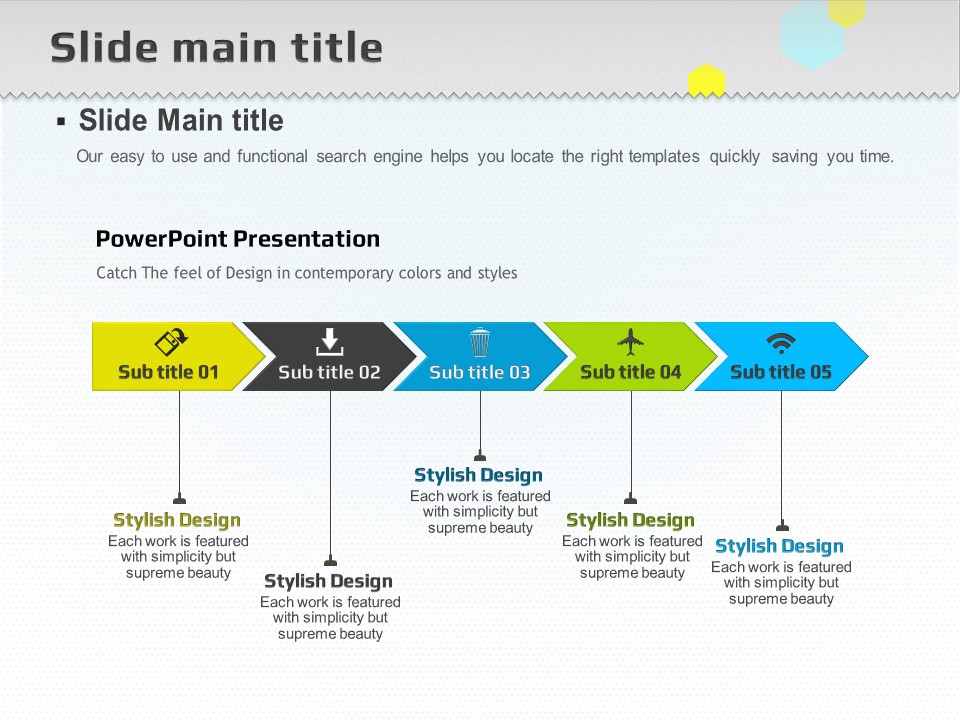
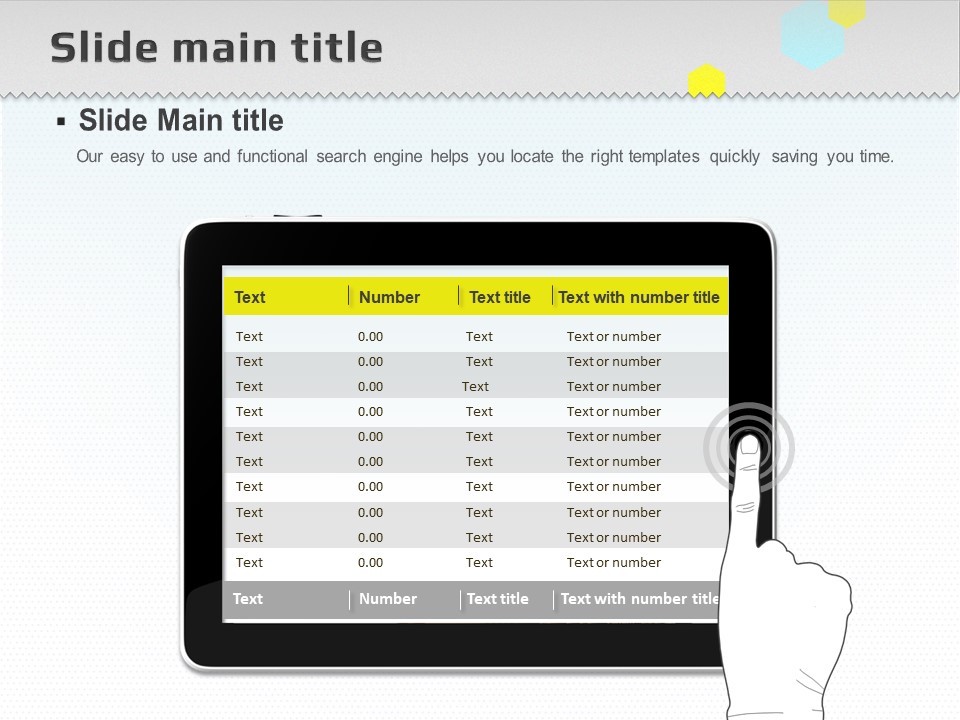
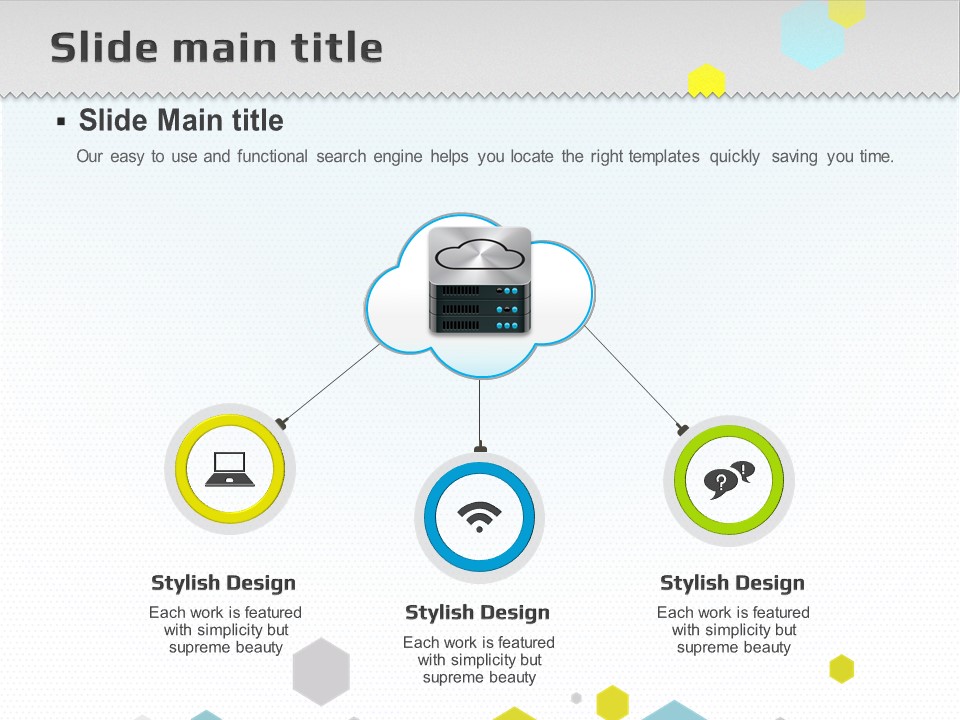
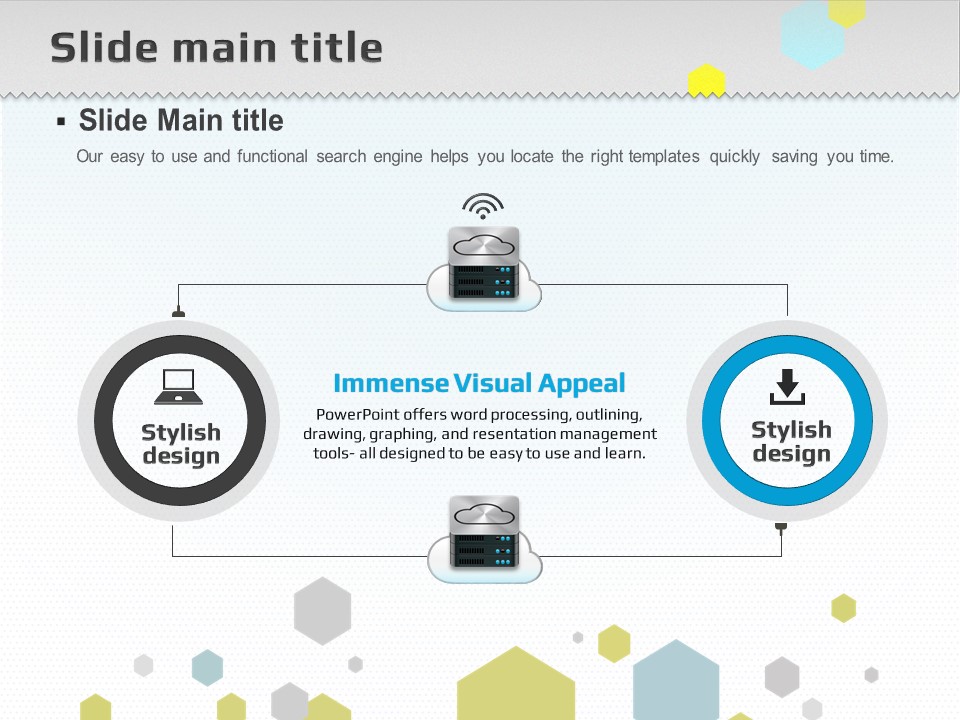
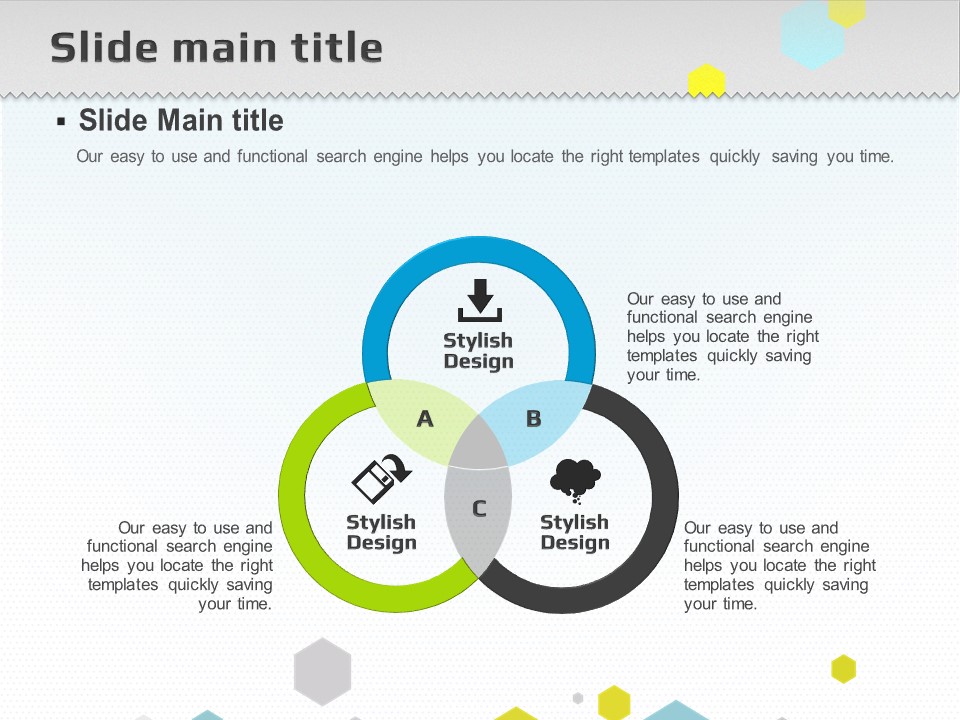
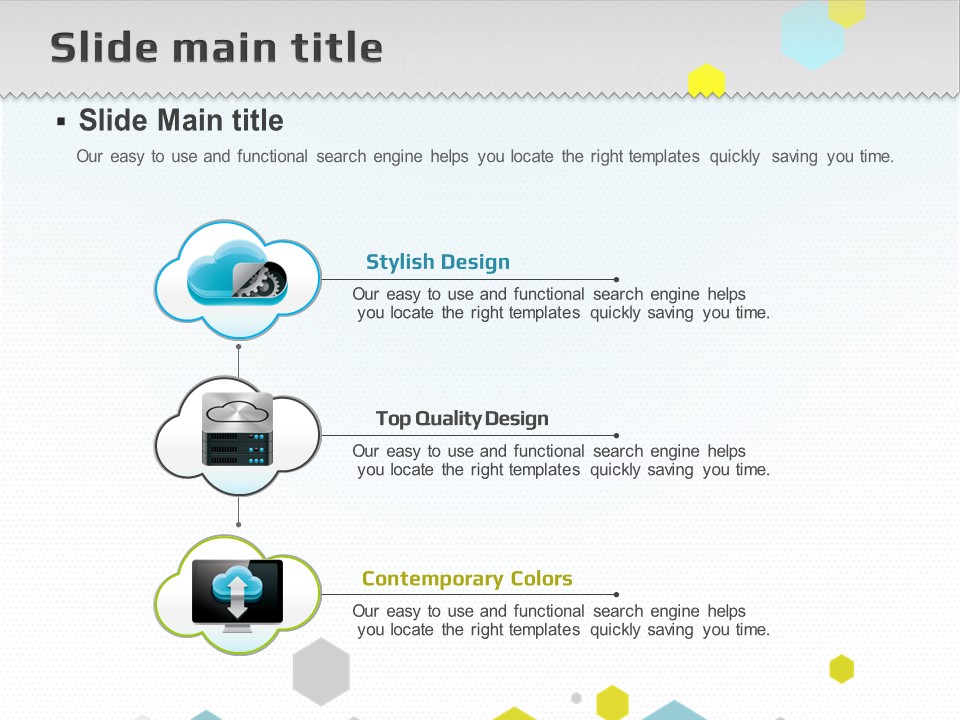
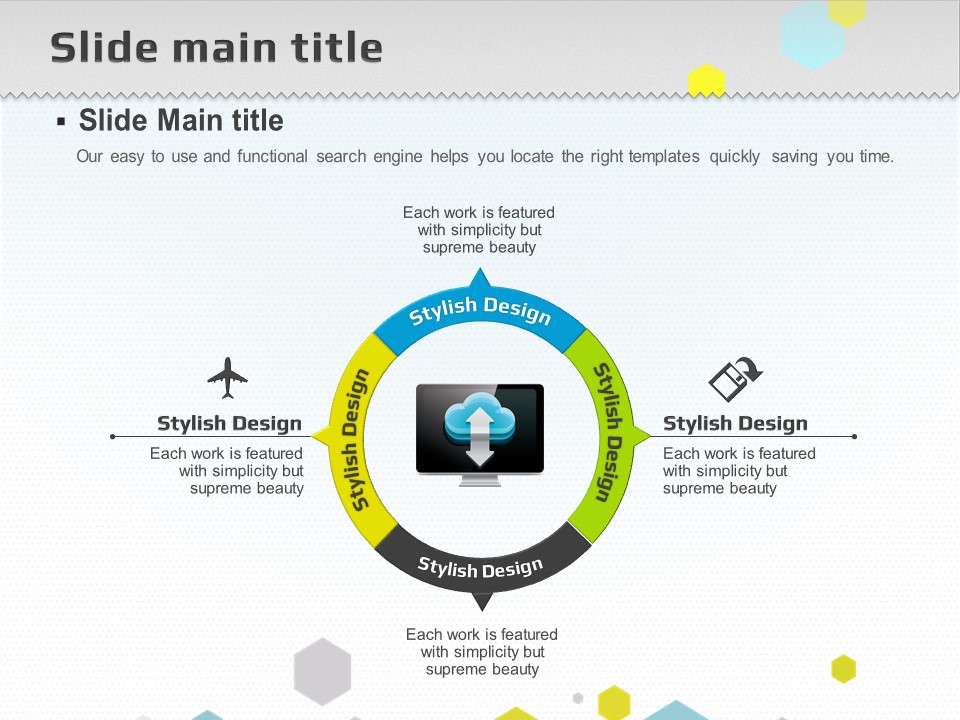
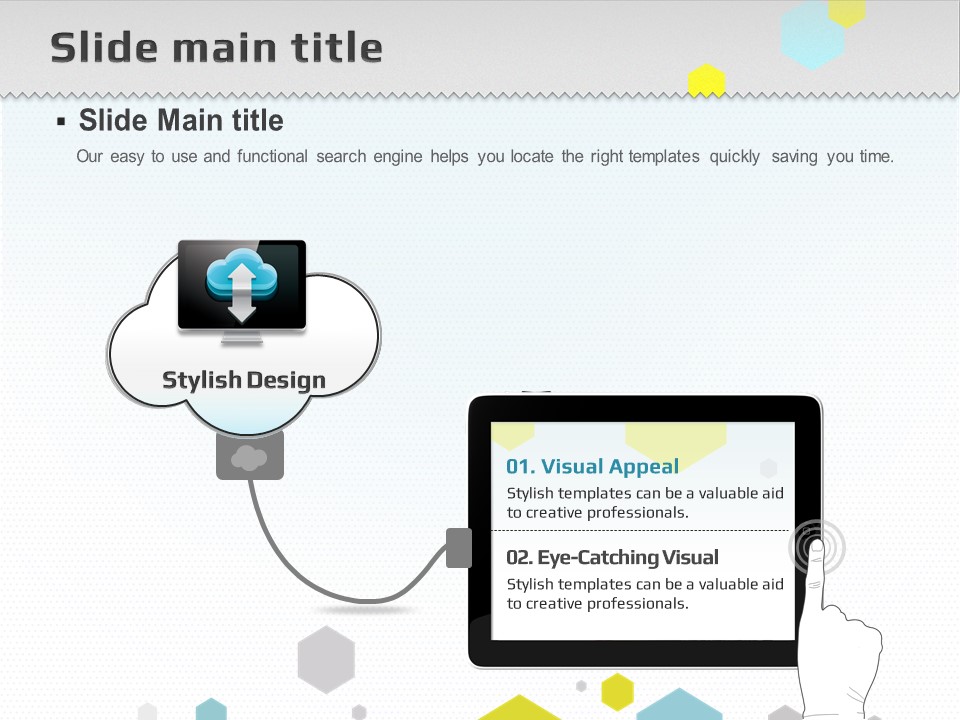
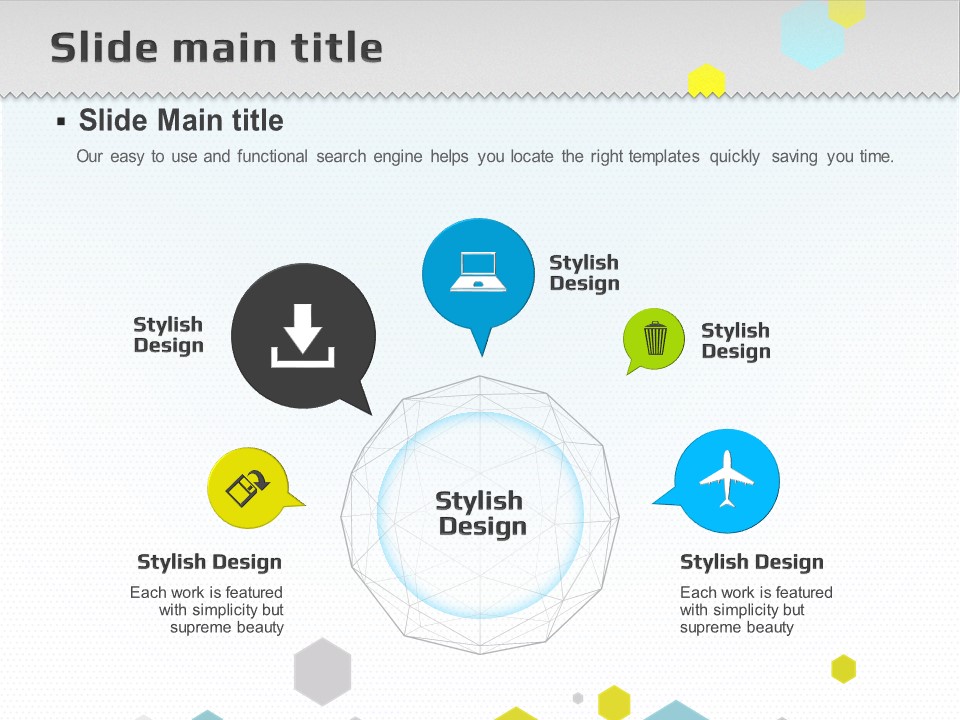
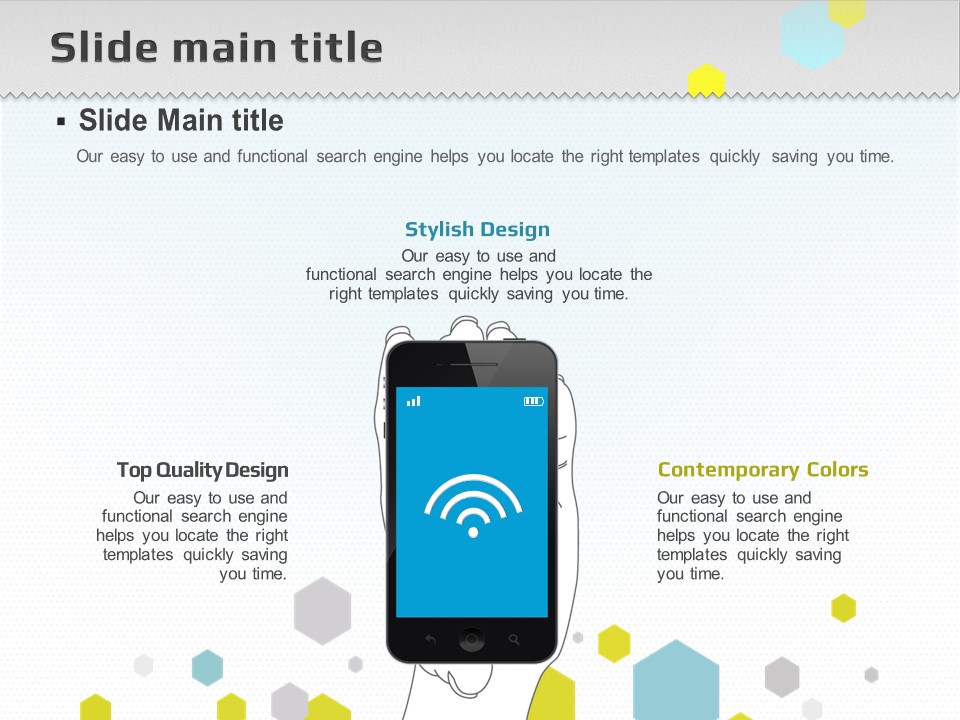
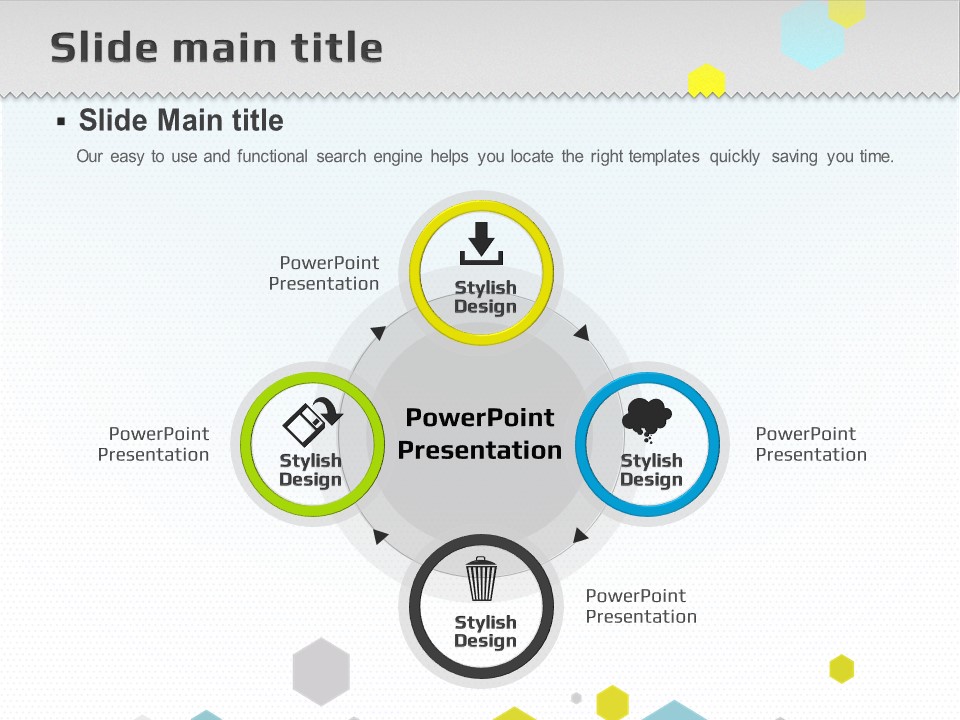
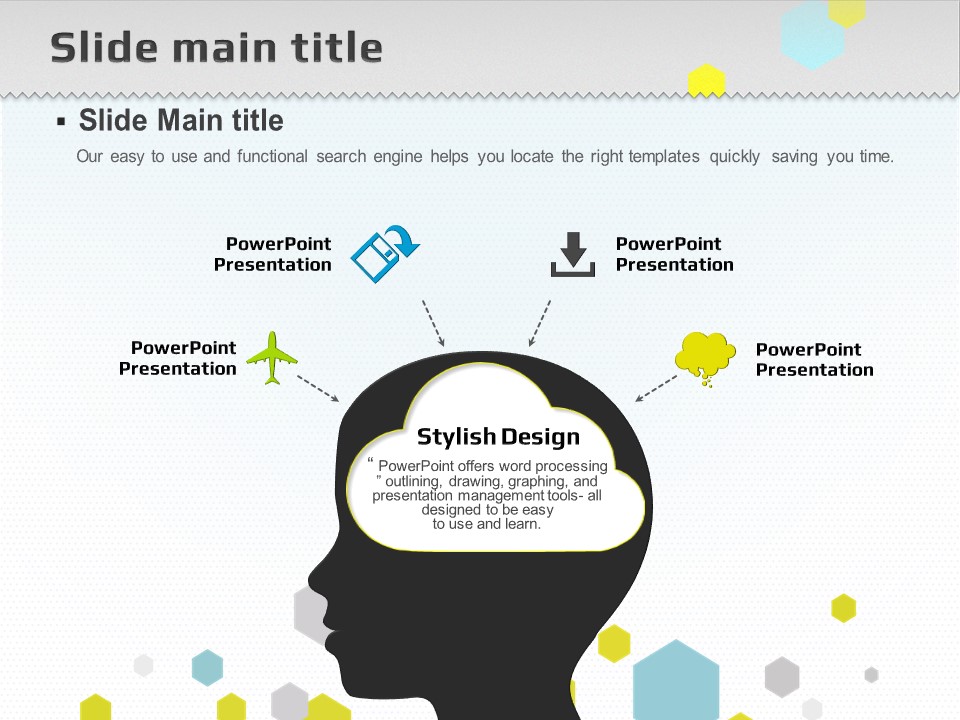
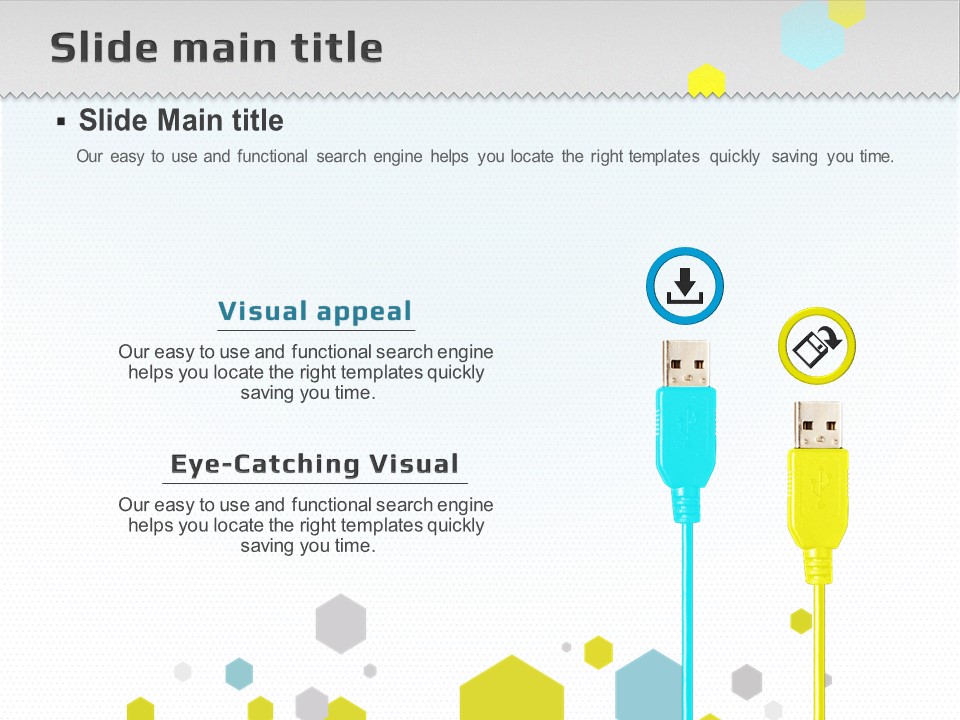
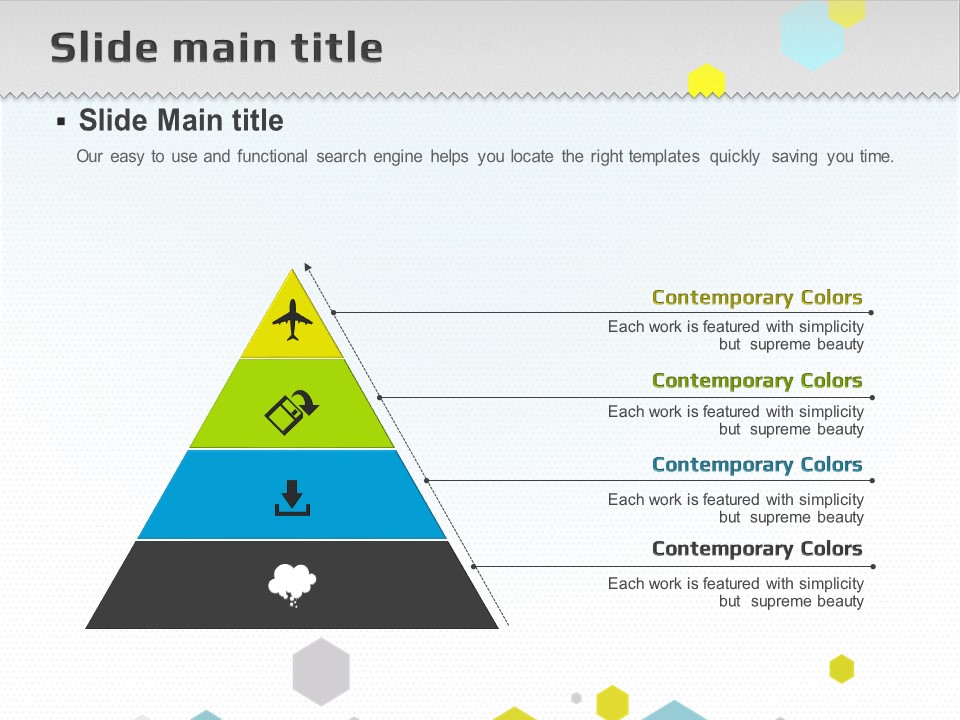
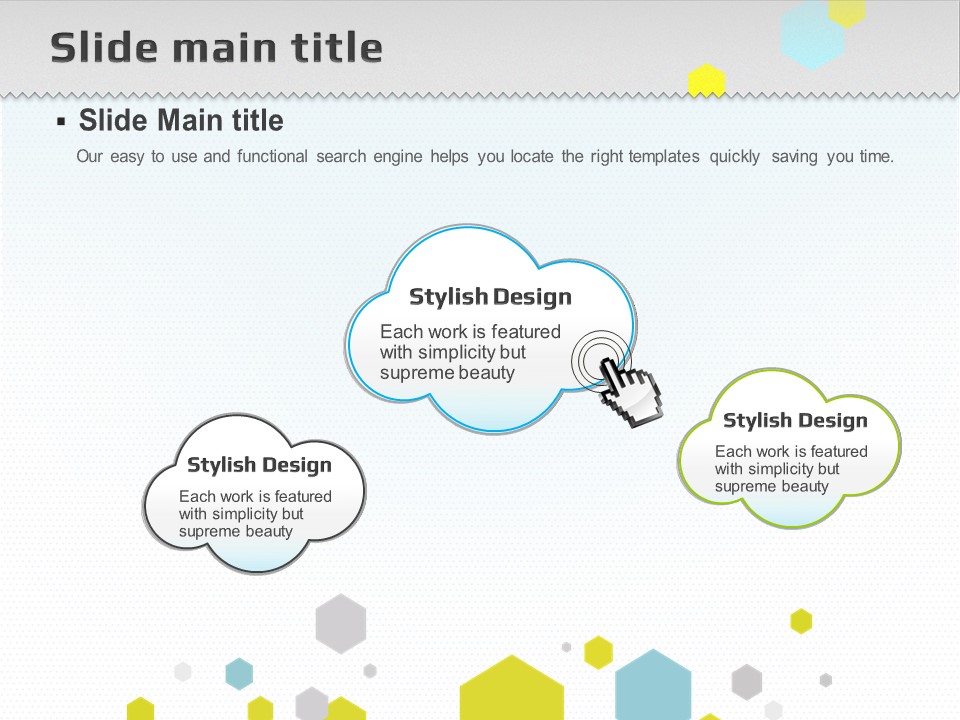
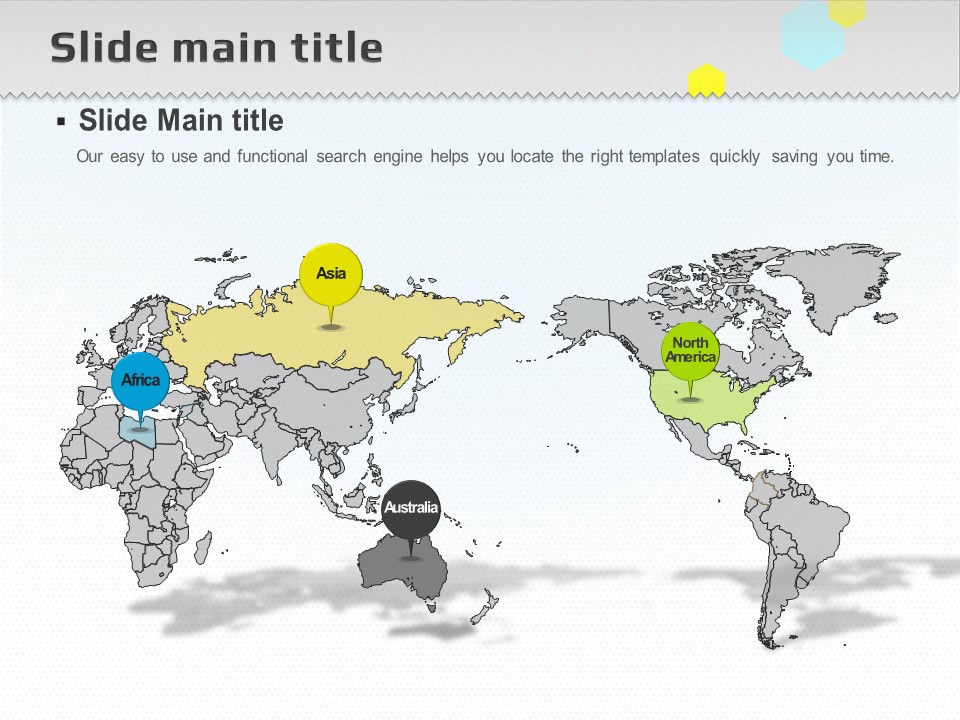
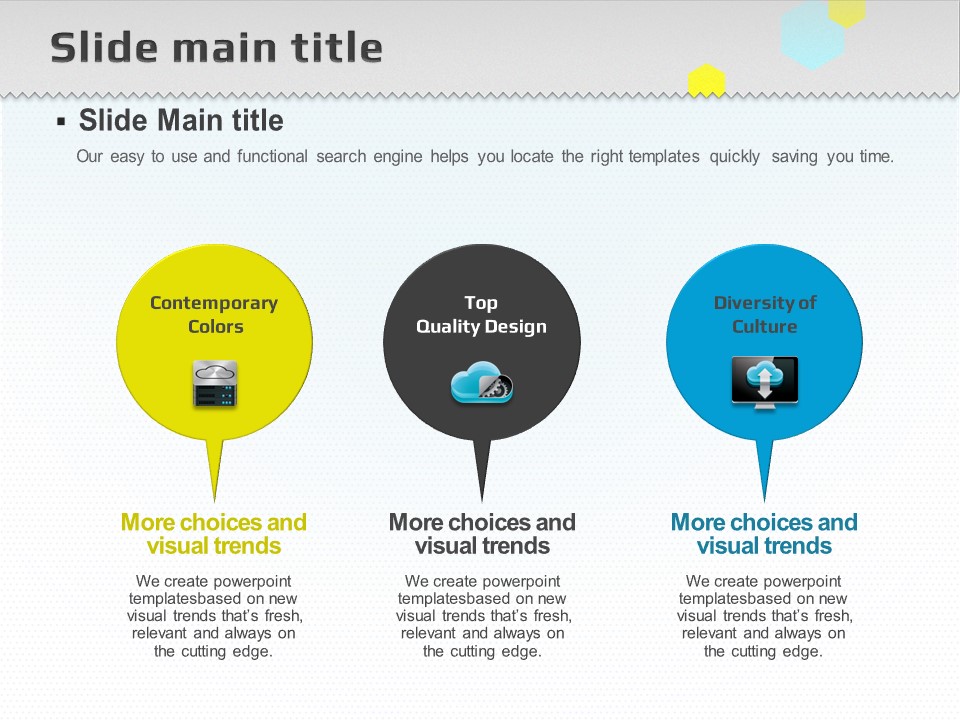
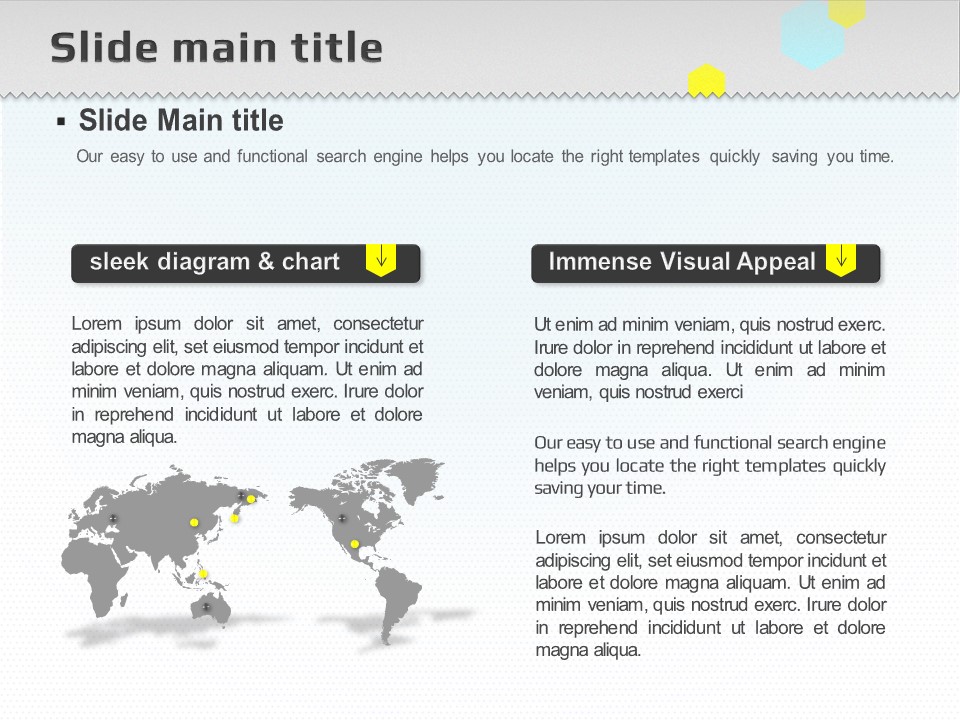
A technology-themed PowerPoint template built around cloud, tablet, and server icons for IT and digital presentations. The design features a light gray background with lime green and sky blue accent colors, creating a clean and energetic look that suits modern tech topics. This 36-slide set covers a wide range of slide types including a title slide with tablet mockup illustration, circular step timelines, radial diagrams, donut charts with percentage indicators, data tables, and arrow-based flowcharts — everything you need for a complete IT presentation deck. The minimal layout with solid-color icons keeps information clear and easy to follow, making it ideal for cloud solution pitches, digital transformation reports, IT service introductions, and startup presentations. Provided in PPTX format with fully editable text, colors, and icons. Optimized for 4:3 ratio projector environments.
Usage Points
-
Main Usage
Designed for IT service introductions, cloud solution pitches, digital transformation reports, and technology-focused presentations. Tablet, cloud, and server icons visually reinforce the IT theme throughout the deck.
-
How to Use
Download the PPTX file and open it directly in PowerPoint. Replace placeholder text and data with your own content. Lime green and sky blue accent colors can be swapped to match your brand, and all icons are fully replaceable.
-
Recommended For
Ideal for IT planners, software development teams, cloud service companies, digital transformation consultants, and startup founders who need professional technology presentation slides.
-
Slide Structure
Includes 36 slides: title slide with tablet mockup illustration, circular step timeline diagrams, radial diagrams, three donut charts with percentage indicators (35%/55%/75%), data tables, and arrow-based flowcharts with branching structures.
Related Products
-

Smart Device Presentation Template – Merging Healthcare and Technology
#IT/Computer
-

Virtual Reality Wide Presentation Template – Modern and Stylish Design
#IT/Computer
-

Mobile Phone PPT Template – Sleek IT Presentation Design
#IT/Computer
-

SEO PowerPoint Wide Template – Modern and Visual-Centric Design
#IT/Computer
