Battery Shape Segmentation Graph – Market Analysis and Product Trends
RB0200014_5
- Last Update 03/08/2025
- File Size 0.8MB
- # of Slides 2
- File Format PPTX
- Slide Ratio 4:3
- Color
Keywords
- #Content-Based Slides
- #Design-Based Slides
- #Product/Service Introduction
- #Market and Competitor Analysis
- #Graph
- #Other
- #Composition
- #Market Analysis
- #4:3
- #battery-shaped graph PowerPoint
- #market analysis slide design
- #segmentation chart template
- #data visualization PowerPoint
- #market trend comparison slide
About the Product
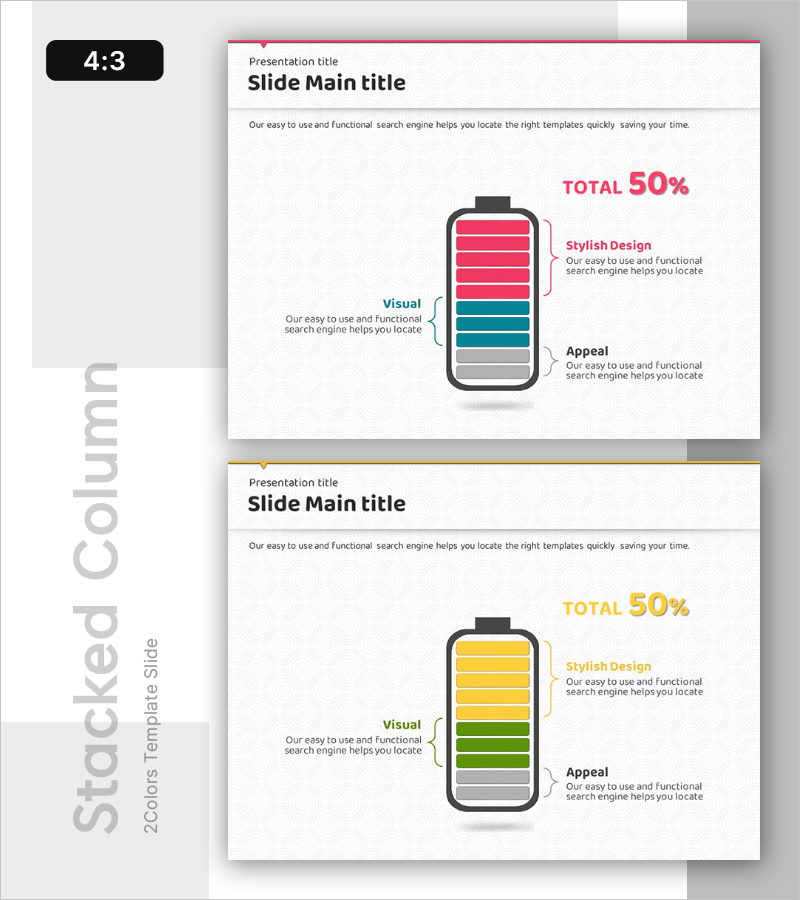
A battery-shaped segmentation graph PowerPoint slide designed to visualize market analysis and product trends with intuitive clarity. This 2-slide PPTX deck in 4:3 aspect ratio features a striking contrast between pink and teal color segments. Each slide combines a battery-form bar chart with dedicated text explanation areas, enabling you to present market share, competitive positioning, customer satisfaction metrics, and comparative data effectively. The layout is ready for immediate use in corporate presentations, investor pitches, and marketing strategy documents.
Usage Points
-
Main Usage
Present comparative market data—market share, competitive strength, customer satisfaction—using a battery-form bar chart that delivers intuitive insights to your audience. This data visualization slide supports fact-based decision-making and strategic planning.
-
How to Use
Deploy in investor presentations, executive reports, and marketing strategy documents within the market analysis section. Use the slide to explain competitive benchmarking, market trends, and product positioning. Simply populate the text areas with specific metrics and interpretations.
-
Recommended For
Marketing managers, strategy planners, financial analysts, and business development professionals presenting market conditions and competitive advantage. Ideal for B2B company investor relations materials, business proposals, and quarterly performance reports.
-
Slide Structure
Two-slide layout with each slide featuring one battery-form bar chart, a left-side explanation text area, and right-side label section. The three-tier hierarchy—pink top (primary metrics), teal middle (comparison items), gray bottom (baseline)—clearly prioritizes data layers for audience comprehension.
Related Products
-

Animal Nature Market Analysis Ratio Infographic – Insight through Data Visualization
#Product/Service Introduction #Market and Competitor Analysis #Graph
-

Network Development Status Graph - Effective Data Visualization
#Product/Service Introduction #Graph #Other
-

Graph Slide Highlighting the Importance of Drinking Water - Market Analysis
#Market and Competitor Analysis #Graph #Other
-

Analysis Graph of Key Performance and Corporate Growth Indicators – Emphasizing Business Achievements
#Business Strategy #Market and Competitor Analysis #Graph
