Weather Impact on Travel Analysis - Market Outlook Graph
RJ0600106_23
- Last Update 07/19/2025
- File Size 2.8MB
- # of Slides 2
- File Format PPTX
- Slide Ratio 16:9
- Color
Keywords
- #Content-Based Slides
- #Design-Based Slides
- #Market and Competitor Analysis
- #Graph
- #Other
- #Future Outlook
- #Market Analysis
- #16:9
- #weather impact analysis PowerPoint slide
- #travel market analysis presentation
- #rising curve graph slide
- #market outlook PPT
- #how to visualize travel industry trends in PowerPoint
About the Product
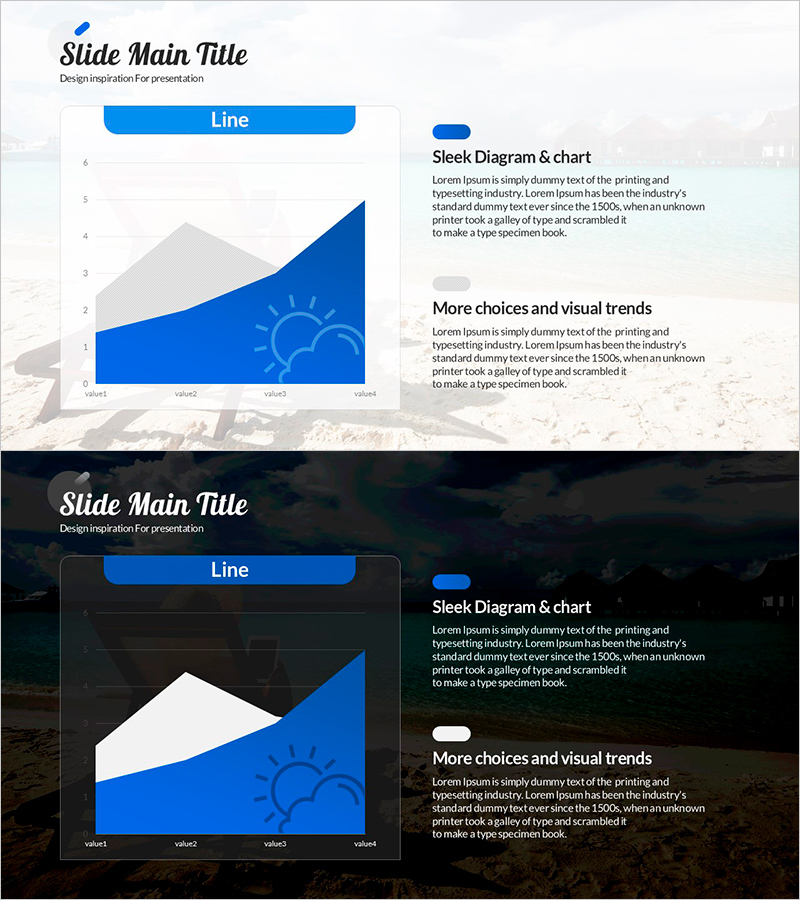
A 2-slide PowerPoint presentation visualizing the impact of weather on the travel industry. The left side features a blue ascending trend graph, while the right side includes 'Sleek Diagram & Chart' and 'More Choices and Visual Trends' sections with descriptive text. The minimal layout uses a light background with blue accent colors to clearly communicate market outlook data. In 16:9 widescreen PPTX format, it is ready for immediate editing and suitable for business presentations and market analysis reports.
Usage Points
-
Main Usage
This slide presents data-driven analysis of how weather influences the travel industry and forecasts market outlook. The ascending curve graph visually emphasizes positive trends, making it ideal for persuasive presentations to investors, partners, and executives about market opportunities.
-
How to Use
Place this slide in the market overview section of business plans, market analysis reports, or investment pitch decks. Input actual data into the left graph area and write analysis insights in the right text boxes to enhance audience comprehension and engagement.
-
Recommended For
Travel agencies, tourism boards, airlines, hotel chains, travel platforms, and marketing or strategy professionals. Ideal for market analysts, investment pitch creators, and business development teams preparing data-driven presentations.
-
Slide Structure
Two-slide deck with the first slide featuring a light background, blue ascending curve graph, and right-side text area (title and two description paragraphs). The second slide offers a dark background version with identical layout for high-contrast presentation options. Each slide includes one graph data input area and three text input zones (title and two body paragraphs).
Related Products
-

Curved Hill Shape Graph – Market Trend and Growth Analysis
#Market and Competitor Analysis #Graph #Other
-

Market Analysis Area Graph – Risk Reduction
#Market and Competitor Analysis #Graph #Other
-

Market Integration Analysis Graph – Future Projections
#Market and Competitor Analysis #Graph #Other
-

Pink Navy Distribution Curve Graph – Effective Solutions for Market Analysis
#Market and Competitor Analysis #Graph #Other
