Animal Nature Market Analysis Ratio Infographic – Insight through Data Visualization
RJ0600074_6
- Last Update 07/10/2025
- File Size 3.1MB
- # of Slides 2
- File Format PPTX
- Slide Ratio 16:9
- Color
Keywords
- #Content-Based Slides
- #Design-Based Slides
- #Product/Service Introduction
- #Market and Competitor Analysis
- #Graph
- #Other
- #Composition
- #Market Analysis
- #16:9
- #market analysis infographic PowerPoint
- #ratio data visualization slide
- #market analysis PowerPoint chart
- #infographic slide design
- #data visualization presentation
About the Product
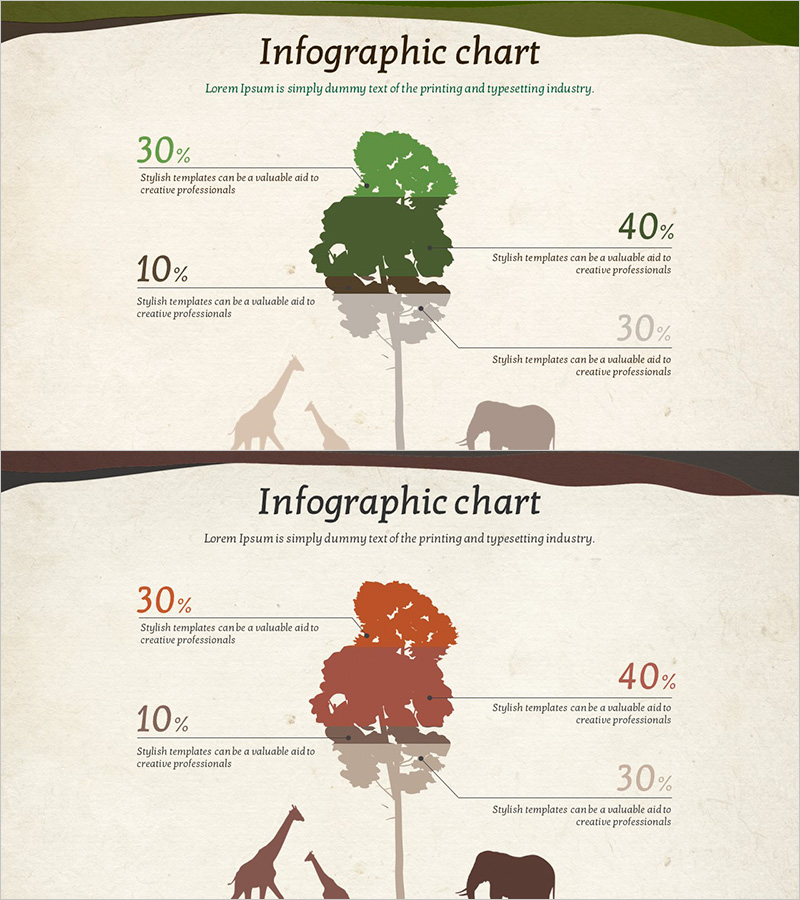
A 2-slide PowerPoint presentation that visualizes market analysis data through intuitive infographic design. Featuring animal and nature motifs, this slide deck displays ratio data (10%, 30%, 40%, 30%) in a 4-tier hierarchical structure. The color palette combines green, brown, and red tones to represent market segmentation, customer composition, revenue distribution, and other analytical metrics. Perfect for presentations, reports, and business proposals that require effective communication of quantitative insights.
Usage Points
-
Main Usage
Present quantitative market data (market share, customer composition, revenue distribution, segmentation ratios) in the market analysis section to support decision-making. The animal and nature-themed infographic design captures audience attention and makes complex numerical data intuitively understandable.
-
How to Use
Input ratio data directly into the slide for market overview, competitive analysis, and target market segmentation presentations. Edit text and numerical values to match your analysis results, and customize colors, backgrounds, and icons while maintaining the overall design tone.
-
Recommended For
Marketing, strategy, and sales professionals presenting market analysis findings to executives, investors, and business partners. Ideal for business plans, investor presentations, marketing proposals, quarterly reports, and any presentation requiring quantitative analysis.
-
Slide Structure
Consists of 2 slides, each centered on a tree motif with 4 ratio data points (10%, 30%, 40%, 30%) positioned around it. Includes 1 title/subtitle area, 4 ratio labels, and 4 descriptive text input fields per slide for flexible customization.
Related Products
-

Battery Shape Segmentation Graph – Market Analysis and Product Trends
#Product/Service Introduction #Market and Competitor Analysis #Graph
-

Galaxy Theme Market Analysis Area Graph
#Market and Competitor Analysis #Graph #Other
-

User Usage Analysis Status Graph
#Market and Competitor Analysis #Graph #Other
-

Network Development Status Graph - Effective Data Visualization
#Product/Service Introduction #Graph #Other
