Progress Comparison Graph – Strategic Visualization for Market Competition
RB0200012_5
- Last Update 03/08/2025
- File Size 2MB
- # of Slides 2
- File Format PPTX
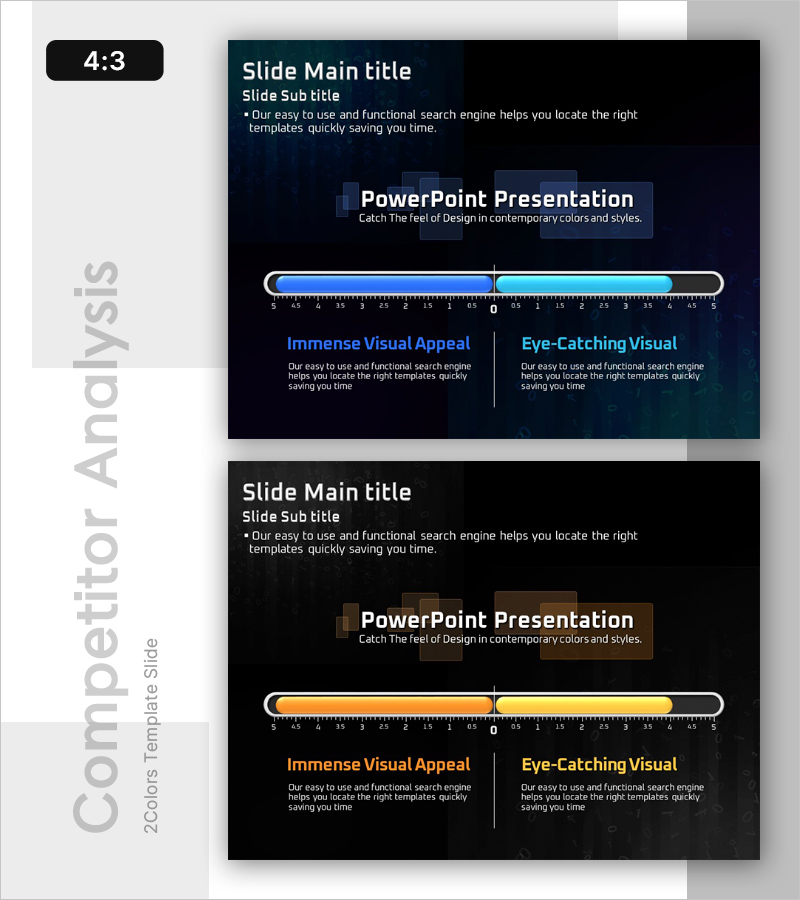
- Slide Ratio 4:3
- Color
Keywords
About the Product
A professional PowerPoint slide for market competition analysis and strategic planning. Featuring a dark navy background with blue and cyan horizontal gauge bars that enable intuitive comparison of two competing metrics. The layout includes a title and subtitle section at the top, dual-color progress bars in the center with ruler-style markings, and a two-column analysis text area at the bottom. Ideal for competitive benchmarking, market share comparison, business goal tracking, and strategic presentations. Ready to customize with your data and insights for immediate use in business meetings and investor pitches.
Usage Points
-
Main Usage
Designed to compare two competing metrics simultaneously—such as company performance vs. competitors, actual results vs. targets, or market share distribution. The high-contrast dark background ensures excellent readability in projector environments and video presentations.
-
How to Use
Enter comparison labels (e.g., Our Company vs. Competitor, Target vs. Actual) in the title area. Adjust the gauge bar lengths and colors to match your data. Fill the two-column text sections below with analysis insights and strategic recommendations to support decision-making.
-
Recommended For
Executive reports, investor presentations, strategy meetings, market analysis briefings, and competitive positioning discussions. Particularly valuable for sales, marketing, and strategy teams presenting competitive advantages and market opportunities.
-
Slide Structure
Two-slide set with consistent layout: title section (1 line), dual horizontal gauge bars (2 metrics), and comparative analysis text (2-column format). 4:3 aspect ratio ensures compatibility with standard projectors and legacy display systems.
Related Products
-

Comparison Bar Chart for Market Competition Analysis – Competitive Advantage
#Market and Competitor Analysis #Graph #Other
-

Korea China Japan Analysis Graph – Market Competitive Advantage
#Market and Competitor Analysis #Graph #Other
-

Goal Achievement Analysis Area Graph – Data-driven Competitive Edge
#Market and Competitor Analysis #Graph #Other
-

Competitor Analysis Area Graph – Visualization for Competitive Advantage
#Market and Competitor Analysis #Graph #Other
