Competitor Analysis Area Graph – Visualization for Competitive Advantage
RJ0300071_12
- Last Update 05/08/2025
- File Size 0.2MB
- # of Slides 2
- File Format PPTX
- Slide Ratio 16:9
- Color
Keywords
About the Product
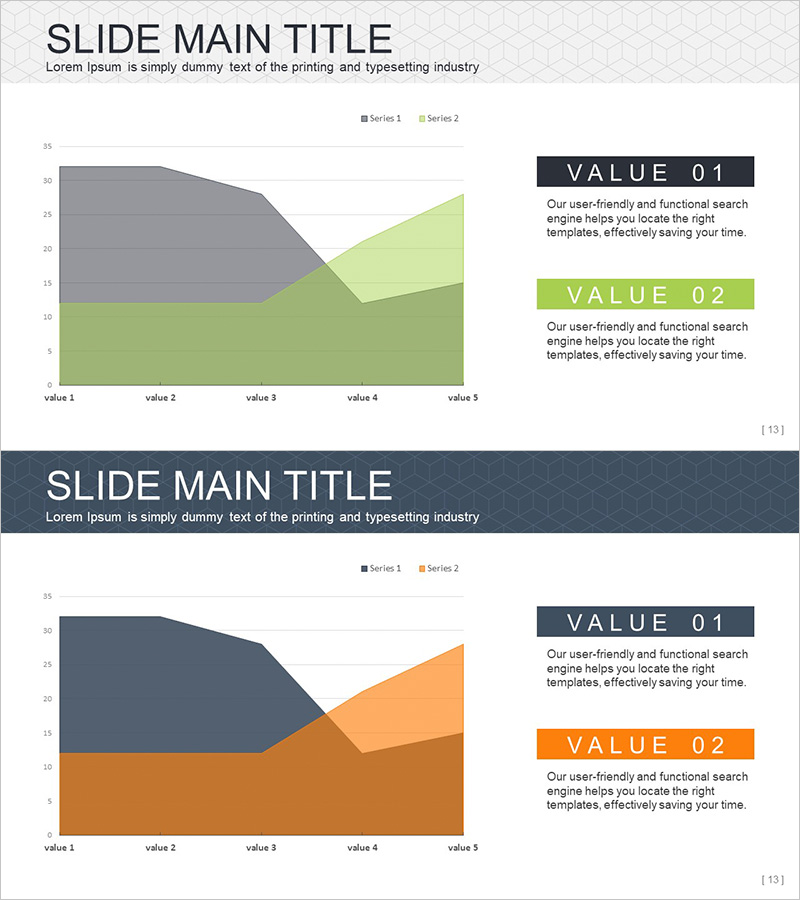
A PowerPoint slide featuring an area graph for visualizing competitive advantage and market positioning. The design compares your company against competitors across five data points using two color schemes: gray-green or gray-orange combinations. The right side includes VALUE 01 and VALUE 02 text boxes to highlight key insights and strategic differentiators. This 2-slide set provides color variations for immediate use in presentations, business plans, and executive reports. The 16:9 widescreen format in PPTX is fully editable across all PowerPoint versions.
Usage Points
-
Main Usage
This slide enables quantitative comparison of your company's performance against competitors across five key metrics, making competitive advantages immediately visible through area graph visualization. The right-side text boxes reinforce strategic messages and support decision-making with clear, data-driven insights.
-
How to Use
Insert this slide into investor pitch decks, business plans, marketing strategy presentations, and executive reports within the market analysis or competitive landscape section. Replace the legend labels (Series 1, Series 2) and X-axis values (value 1–5) with your actual data, then customize the VALUE 01 and VALUE 02 text boxes with your competitive strengths.
-
Recommended For
Strategy managers, marketing professionals, executives, and investor relations teams presenting competitive analysis and market positioning. Ideal for new market entry strategies, product differentiation, and market share growth narratives.
-
Slide Structure
Title area at top, central area graph with five data points and two data series, and two text boxes (VALUE 01 and VALUE 02) on the right. The 2-slide set includes color variations (green and orange) to match your presentation's visual identity.
Related Products
-

Vertical Bar Chart Slide for Business Competitive Advantage Analysis
#Market and Competitor Analysis #Graph #Other
-

Competitive Comparison Area Diagram – Visualizing Market Advantage
#Market and Competitor Analysis #Graph #Other
-

Korea China Japan Analysis Graph – Market Competitive Advantage
#Market and Competitor Analysis #Graph #Other
-

Mobile App Competitor Analysis – Visualizing Market Share
#Market and Competitor Analysis #Graph #Other
