User Experience Advantage Analysis Chart – Visualizing Competitive Edge
RB0300014_5
- Last Update 03/10/2025
- File Size 1.1MB
- # of Slides 2
- File Format PPTX
- Slide Ratio 4:3
- Color
Keywords
- #Content-Based Slides
- #Design-Based Slides
- #Product/Service Introduction
- #Market and Competitor Analysis
- #Diagram
- #Graph
- #Development Status
- #Competitive Advantage
- #Cluster
- #Circles
- #Closed Cluster Diagram
- #Doughnut Chart
- #4:3
- #donut chart PowerPoint slide
- #pie chart template
- #competitive analysis visualization
- #market advantage chart
- #multi-segment donut graph template
About the Product
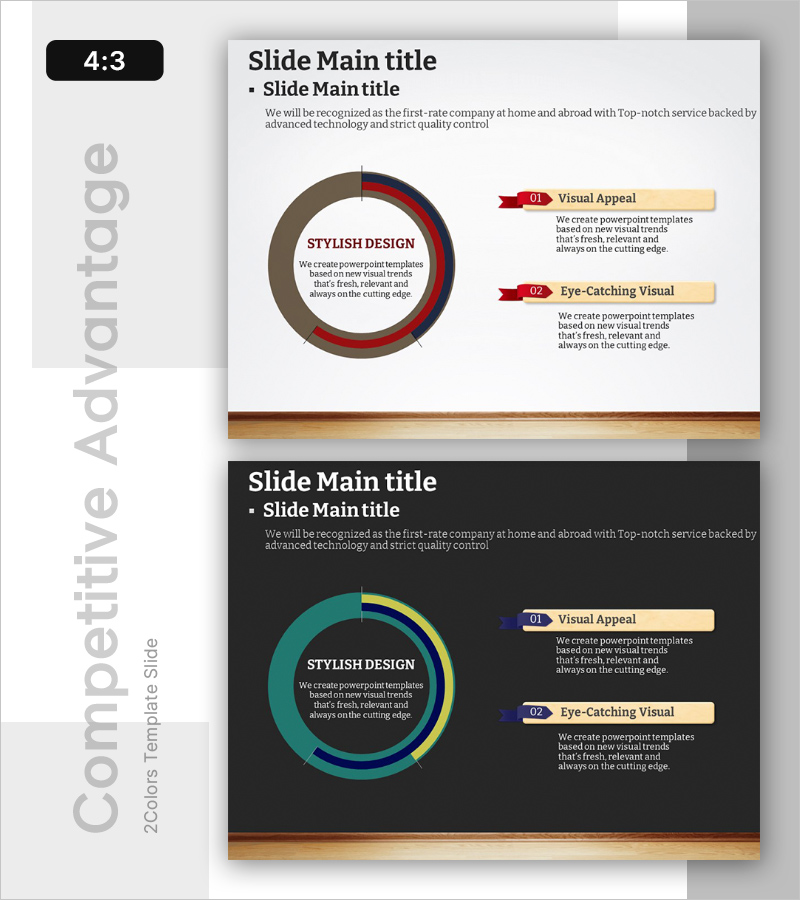
A donut chart PowerPoint slide designed to visualize user experience-based competitive advantages through multi-segment comparison. The center circle emphasizes the core message while the outer donut ring is divided into three data segments in brown, red, and blue tones, clearly distinguishing each competitive factor. Connected callout text boxes on the right provide detailed explanations for each segment. This slide template is ready to use in presentations, proposals, and marketing plans for competitive analysis sections.
Usage Points
-
Main Usage
Optimized for visualizing your company's user experience advantages against competitors through proportional donut segments. The center-focused donut structure emphasizes core messaging while outer segments enable detailed item comparison, supporting decision-making in market analysis, product positioning, and strategic planning phases.
-
How to Use
Two-slide set with light and dark background options. First slide features brown, red, and blue donut segments with two connected callout boxes on the right. Second slide repeats the same structure with teal and yellow tones for design variety. Edit each donut segment and text box to input your actual competitive analysis data.
-
Recommended For
Marketing managers, strategy teams, and executives presenting competitive analysis to stakeholders, investors, and clients. Ideal for market analysis and competitive advantage sections in business plans, investor pitch decks, proposals, and marketing strategies. Product development teams can also use it to communicate user experience-based positioning.
-
Slide Structure
Two donut chart slides (light and dark backgrounds). Each slide features a center circle with 'STYLISH DESIGN' text and description, surrounded by a donut ring divided into three segments (brown/red/blue or teal/yellow/blue). Two numbered callout boxes (01, 02) on the right explain each segment. 4:3 aspect ratio, fully editable PPTX format.
Related Products
-

Doughnut Chart for Logistics Performance – Analysis by Transport Method
#Product/Service Introduction #Market and Competitor Analysis #Diagram
-

Transportation Services Competitive Advantage Comparison Graph
#Product/Service Introduction #Market and Competitor Analysis #Diagram
-

Cell Phone Development Status Analysis Chart – Competitive Advantage and Insights
#Product/Service Introduction #Market and Competitor Analysis #Diagram
-

Doughnut Chart Slide for Market and Competitive Analysis – Sports Trends & Strategic Issues
#Market and Competitor Analysis #Diagram #Graph
