Salt Farm Production Analysis – Market Situation Visualization
RB0100077_9
- Last Update 03/07/2025
- File Size 2.1MB
- # of Slides 2
- File Format PPTX
- Slide Ratio 4:3
- Color
Keywords
About the Product
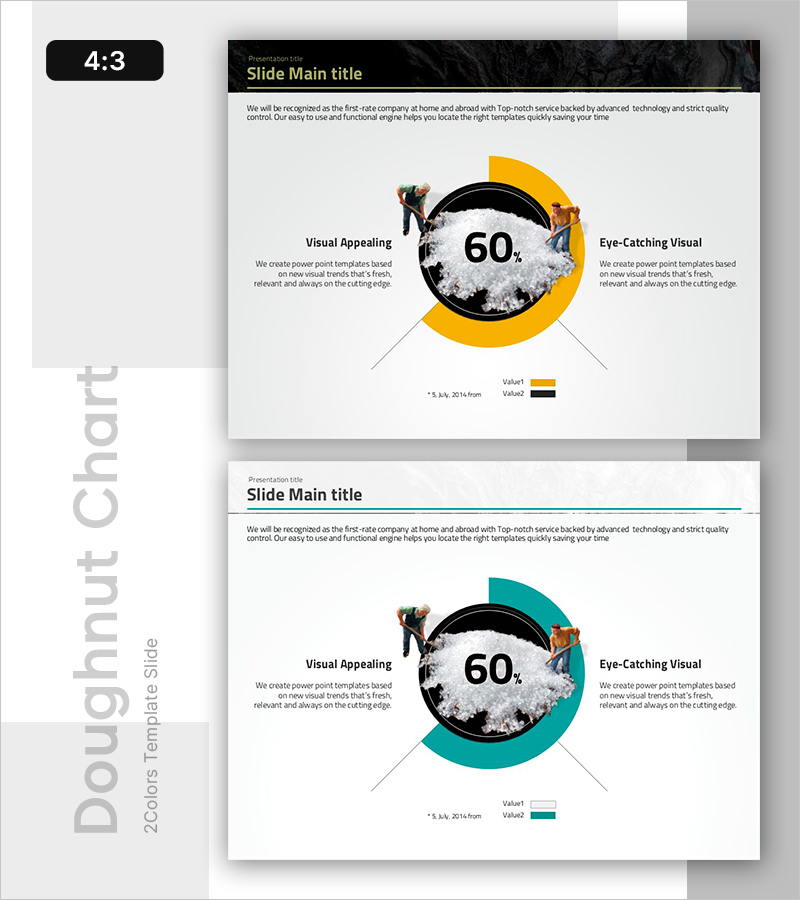
A PowerPoint slide featuring a donut chart that emphasizes numerical data in the center while displaying proportions through the surrounding ring. The design uses yellow and black color contrast to enhance data readability, with text areas positioned on the left and right for descriptions. This slide is ideal for presenting production analysis, market share, competitive comparison, and other key metrics in business presentations. The 4:3 aspect ratio 2-slide set is ready to edit and use immediately.
Usage Points
-
Main Usage
Donut charts effectively display the proportion of parts relative to the whole. By placing key metrics (such as 60%) in the center, you can emphasize important data at a glance. This template is suitable for production analysis, market share reporting, competitive benchmarking, resource allocation, and various business scenarios requiring proportion visualization.
-
How to Use
Replace the center numbers and left-right text areas with your own data. The donut ring colors and proportions can be adjusted using PowerPoint's chart editing tools. Add legends and descriptive text to customize the slide for your presentation context.
-
Recommended For
Ideal for executive reports, business performance presentations, marketing strategy meetings, and financial analysis documents. Particularly effective for explaining production metrics, market analysis, competitive positioning, and resource distribution. Commonly used by executives, analysts, and planners in manufacturing, distribution, finance, and consulting sectors.
-
Slide Structure
2-slide set with the first slide featuring a yellow donut chart (60% proportion display) and the second featuring a teal donut chart. Each slide has a centered numerical value, left-right text areas labeled 'Visual Appealing' and 'Eye-Catching Visual', and a legend at the bottom in 4:3 aspect ratio layout.
Related Products
-

Achievement Goals and Status Chart – Visualizing Competitive Advantage
#Market and Competitor Analysis #Graph #Market Status
-

Key Metrics for Promotion Success - Essential Analysis for Successful Business
#Business Strategy #Market and Competitor Analysis #Graph
-

Donut Chart Depicting Market Share – Status of Home Repair Support Projects
#Market and Competitor Analysis #Graph #Market Status
-

Donut Chart Slide for Interior Demand Survey
#Market and Competitor Analysis #Financial Plans and Performance #Graph
