Achievement Goals and Status Chart – Visualizing Competitive Advantage
RB0800018_7
- Last Update 03/21/2025
- File Size 0.1MB
- # of Slides 2
- File Format PPTX
- Slide Ratio 4:3
- Color
Keywords
- #Content-Based Slides
- #Design-Based Slides
- #Market and Competitor Analysis
- #Graph
- #Market Status
- #Competitive Advantage
- #Circles
- #Doughnut Chart
- #4:3
- #donut chart PowerPoint
- #pie chart presentation slide
- #goal achievement rate visualization
- #competitive advantage chart
- #proportion data PowerPoint template
About the Product
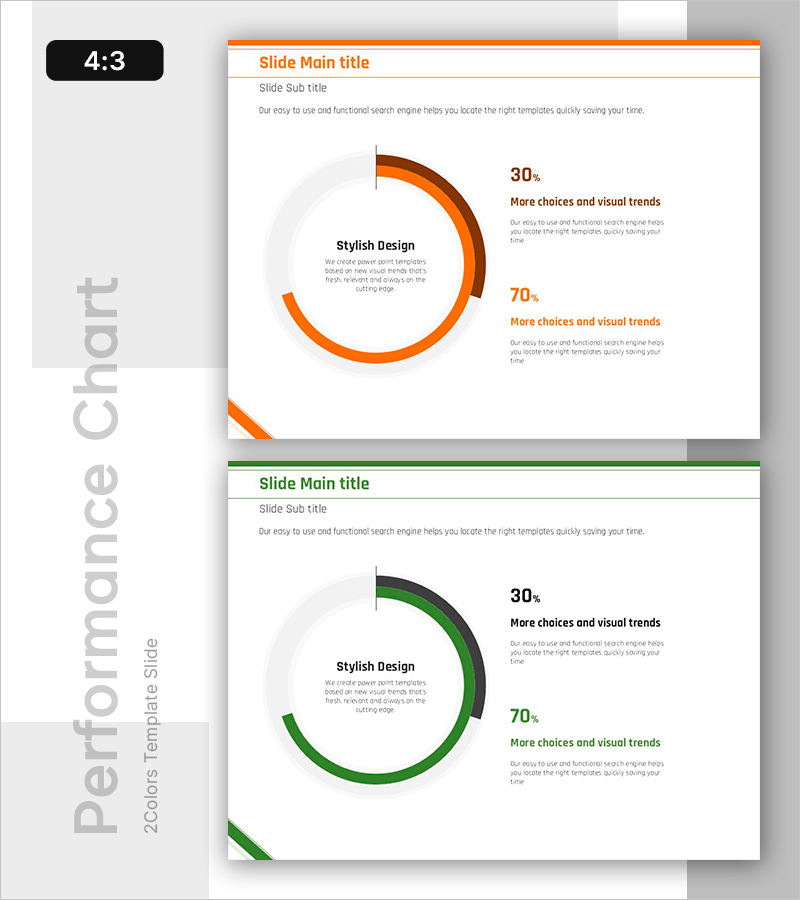
A donut chart PowerPoint slide that visualizes goal achievement status and competitive advantage. The design features a two-series donut chart in orange and dark brown gradient tones, clearly expressing 30% and 70% proportions. A 'Stylish Design' text area is positioned at the center to emphasize key messages, with numerical values and descriptive text arranged on the right side. This 4:3 aspect ratio presentation consists of 2 slides ready for immediate use.
Usage Points
-
Main Usage
Express proportional data such as business performance, market share, and goal achievement rates through a donut chart for intuitive audience communication. The center text area emphasizes key messages and maximizes impact.
-
How to Use
Use in executive reports, business plans, and marketing proposals within performance sections to explain goal-to-actual results, market status, and competitive advantages. Easily modify numerical values to apply to various proportion datasets.
-
Recommended For
Ideal for presentations to executives, marketing managers, sales teams, consultants, and investors. Recommended for quarterly performance reports, market analysis, and competitive comparison materials.
-
Slide Structure
2-slide set. Each slide comprises an orange header bar, two-series gradient donut chart, center text box, and right-aligned numerical values with descriptive text. Formatted in 4:3 aspect ratio.
Related Products
-

Market Status Analysis with Donut Chart – Attractive Colors
#Market and Competitor Analysis #Graph #Market Status
-

SUV Percentage Donut Graph – Market Status Analysis
#Market and Competitor Analysis #Diagram #Graph
-

Current Status as Seen in a Donut Chart – Slide Representing Competitive Advantage
#Market and Competitor Analysis #Graph #Market Status
-

Comparative Donut Charts by Data Type – Market Status and Competitive Advantage
#Market and Competitor Analysis #Graph #Market Status
