Donut Chart Depicting Market Share – Status of Home Repair Support Projects
RJ0900026_12
- Last Update 08/23/2025
- File Size 0.5MB
- # of Slides 2
- File Format PPTX
- Slide Ratio 16:9
- Color
Keywords
About the Product
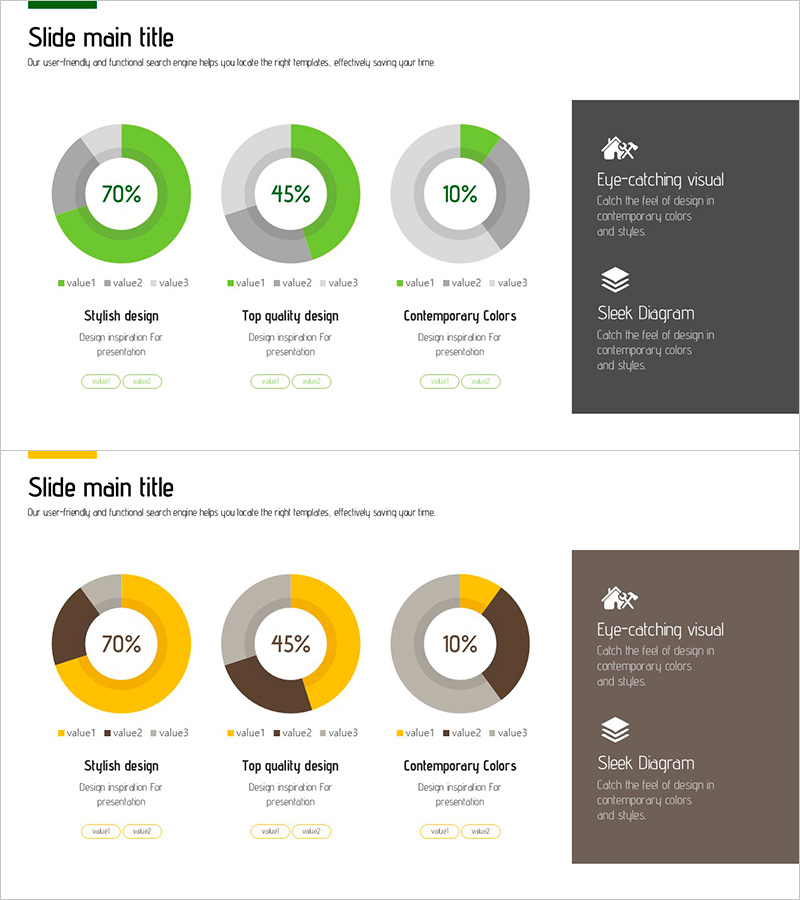
A 3-segment donut chart PowerPoint slide designed to visualize market share, business status, and composition ratios. The donut charts feature green, yellow, and brown color series, with central percentage values (70%, 45%, 10%) and legends that make data interpretation intuitive and accessible. This 2-slide set is ready to use immediately for market analysis presentations, business performance reports, and investment pitch decks.
Usage Points
-
Main Usage
Visualize and compare multiple data segments and their proportions in market research, business performance analysis, and investment reports using donut charts. Central figures and legends clearly communicate quantitative data to stakeholders.
-
How to Use
Insert into executive reports, business plan presentations, market analysis documents, and investor pitch decks—particularly in market overview and competitive analysis sections. Edit the color series and numerical values to match your specific data.
-
Recommended For
Marketing managers, executives, business planners, investment professionals, and consultants presenting market share, business composition, customer distribution, revenue breakdown, and similar comparative metrics.
-
Slide Structure
Three donut charts (each with 3 segments), central percentage values (70%, 45%, 10%), legend (value1·value2·value3), and descriptive text area at bottom. 2-slide set with color variations (green, yellow, brown series).
Related Products
-

Visualizing Value Ratios with Pie Charts – Essential Presentation Template
#Market and Competitor Analysis #Diagram #Graph
-

Guide to Admission Evaluation Criteria with Donut Chart
#Market and Competitor Analysis #Graph #Market Status
-

Management System Donut Chart Slide – Market Share and Status
#Market and Competitor Analysis #Graph #Market Status
-

Market Share Analysis Graph by Technology – Competition and Collaboration
#Market and Competitor Analysis #Diagram #Graph
