Key Metrics for Promotion Success - Essential Analysis for Successful Business
RJ0200071_5
- Last Update 09/09/2025
- File Size 5.7MB
- # of Slides 2
- File Format PPTX
- Slide Ratio 16:9
- Color
Keywords
- #Content-Based Slides
- #Design-Based Slides
- #Business Strategy
- #Market and Competitor Analysis
- #Graph
- #Achievements
- #Market Status
- #Circles
- #Doughnut Chart
- #16:9
- #circular progress chart PowerPoint
- #KPI visualization slide
- #3-metric comparison template
- #promotion performance dashboard
- #pie chart PowerPoint slide design
About the Product
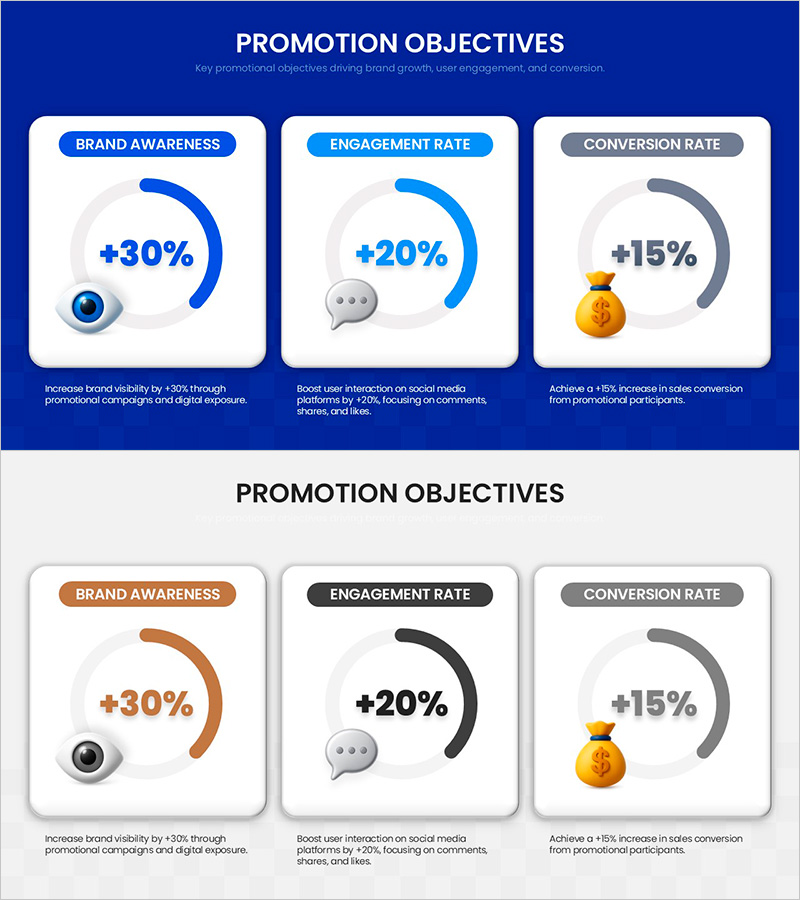
A professional circular progress chart PowerPoint slide designed to showcase promotion performance metrics. This template visualizes three key performance indicators—brand awareness, engagement rate, and conversion rate—using concentric circular progress bars with percentage values (+30%, +20%, +15%). Each metric is paired with a descriptive icon (eye, chat bubble, money bag) and supporting text to enhance clarity and impact. The slide features a deep blue background with white, blue, and gray accent colors for visual hierarchy. Two layout variations are included: one with dark blue background and one with light background, allowing flexibility for different presentation environments. Fully editable PPTX format with 16:9 widescreen ratio.
Usage Points
-
Main Usage
Present promotion campaign results to executives, marketing teams, and stakeholders using a clear, data-driven circular progress visualization. The three-metric layout enables quick comparison of brand awareness, user engagement, and conversion performance in a single visual frame.
-
How to Use
Ideal for quarterly business reviews, marketing performance reports, and executive presentations. Use slide 1 (dark background) in dimly lit conference rooms or slide 2 (light background) in bright environments. Customize percentage values and metric labels to match your campaign data.
-
Recommended For
Marketing managers, business executives, sales leaders, consultants, and advertising agency professionals presenting promotion effectiveness and ROI metrics to stakeholders.
-
Slide Structure
Two slides with identical layout structure: 3 circular progress charts arranged horizontally. Each chart displays a gray background circle with colored progress arc (blue, blue, gray), centered percentage value, metric label, and descriptive text below. Slide 1 features dark blue background; Slide 2 uses light background for contrast flexibility.
Related Products
-

Donut Chart for Adventure Supplies – Business Strategy
#Business Strategy #Market and Competitor Analysis #Graph
-

Donut Chart Visualizing SUV Functions – Market Analysis and Performance
#Business Strategy #Market and Competitor Analysis #Graph
-

Market Status Chart Analysis – Data-Driven Insights
#Business Strategy #Market and Competitor Analysis #Graph
-

Chart of Changes in the Ratio of Institutional and Individual Investors – Simplified Shareholder Composition
#Company Introduction #Market and Competitor Analysis #Graph
