Contribution of Environmental Factors to Growth – Donut Chart
RB0100077_7
- Last Update 03/07/2025
- File Size 1.6MB
- # of Slides 2
- File Format PPTX
- Slide Ratio 4:3
- Color
Keywords
- #Content-Based Slides
- #Design-Based Slides
- #Business Strategy
- #Market and Competitor Analysis
- #Graph
- #Achievements
- #Future Outlook
- #Circles
- #Doughnut Chart
- #4:3
- #donut chart PowerPoint slide
- #pie chart template download
- #ratio analysis presentation
- #environmental data visualization
- #how to create donut chart in PowerPoint
About the Product
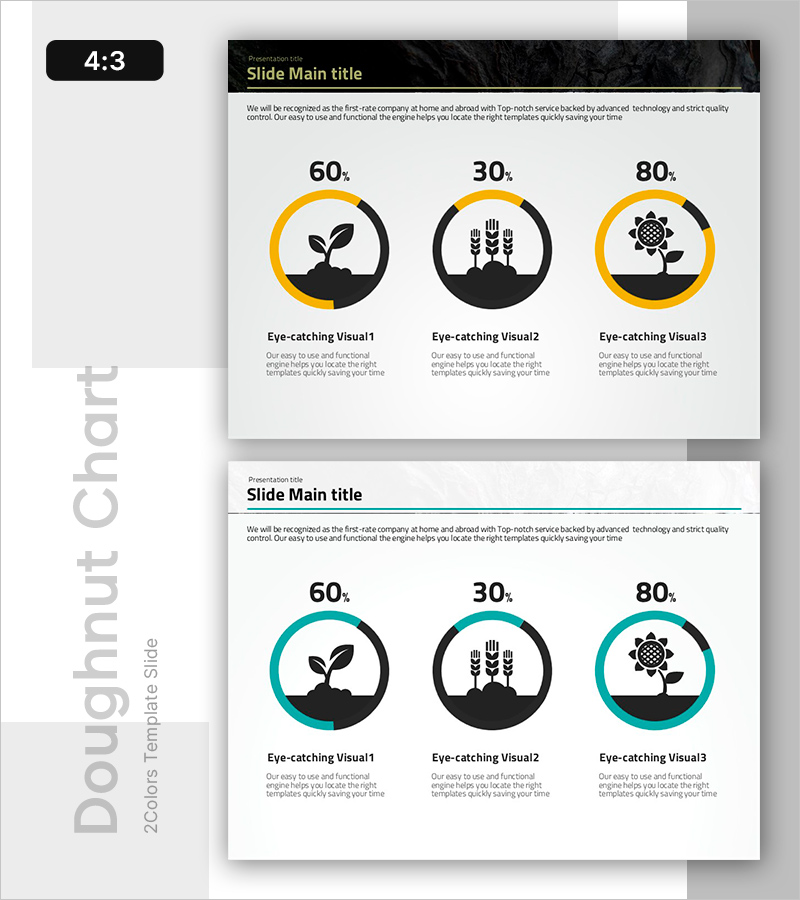
A donut chart PowerPoint slide that visualizes the contribution of three environmental factors to plant growth with clear percentage breakdowns (60%, 30%, 80%). The design uses golden and black contrast to highlight each segment, with icons representing plant, grain, and sunflower elements for intuitive data communication. This 2-slide presentation template is ready to use immediately in business reports, market analysis, and environmental studies.
Usage Points
-
Main Usage
Ideal for displaying proportional relationships between multiple elements, such as market segments, environmental factors, or contribution percentages. The donut structure allows central placement of key metrics or titles, enhancing information clarity and audience engagement.
-
How to Use
Apply this slide in business strategy presentations, market analysis reports, and performance summaries where multi-factor composition needs explanation. Easily edit segment percentages, labels, and icons to match your specific data and branding requirements.
-
Recommended For
Marketing professionals, business strategists, environmental and agricultural specialists, and data analysts preparing quantitative reports. Suitable for any presentation requiring persuasive visual communication of statistical data to stakeholders.
-
Slide Structure
2-slide set with 3-segment donut charts as the focal point. Golden accent lines and black icons create visual hierarchy. 4:3 aspect ratio ensures compatibility with standard projectors and presentation systems.
Related Products
-

Market Trends and Analysis Charts – Delivering Business Insights
#Business Strategy #Market and Competitor Analysis #Graph
-

Performance Graph by Year – Results and Future Outlook
#Business Strategy #Market and Competitor Analysis #Graph
-

Progress Donut Chart for Each Library Service
#Business Strategy #Market and Competitor Analysis #Graph
-

Orange Green Rising Numerical Graph – Performance and Future Outlook
#Business Strategy #Market and Competitor Analysis #Graph
