Donut Chart for Business Strategy Visualization – Performance-Focused Marketing
RJ0200067_15
- Last Update 04/18/2025
- File Size 0.6MB
- # of Slides 2
- File Format PPTX
- Slide Ratio 16:9
- Color
Keywords
- #Content-Based Slides
- #Design-Based Slides
- #Business Introduction
- #Business Strategy
- #Marketing Plan and Strategy
- #Graph
- #Revenue Model
- #Achievements
- #Circles
- #Doughnut Chart
- #16:9
- #donut chart PowerPoint
- #pie chart slide template
- #performance ratio visualization
- #marketing strategy presentation
- #donut graph download
About the Product
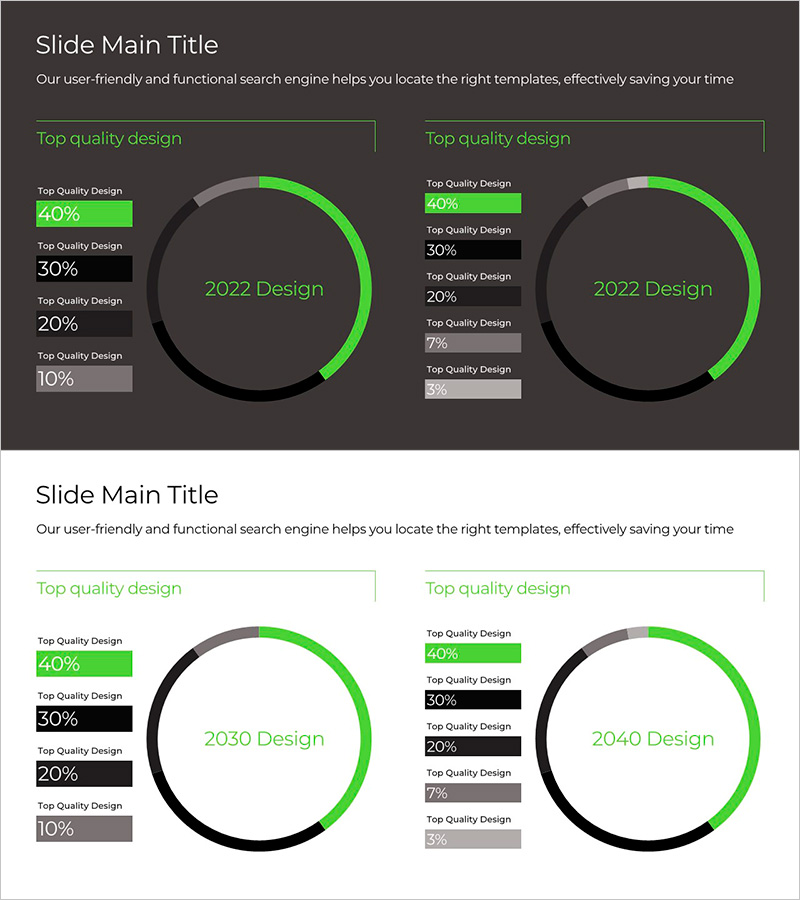
A 2-slide PowerPoint set that visualizes business performance and marketing strategy using donut charts with clear data representation. Designed with dark gray background and lime green accent color for high contrast visibility. Each slide features a vertical bar label layout on the left (40%, 30%, 20%, 10% segments) combined with a centered circular donut chart. Perfect for year-over-year performance comparison (2022, 2030, 2040) or marketing channel contribution analysis. Provided in 16:9 widescreen PPTX format with fully editable text and numerical values for immediate customization and presentation use.
Usage Points
-
Main Usage
Effectively communicate business performance analysis, marketing channel contribution, budget allocation ratios, and customer satisfaction composition using donut charts with 5+ data segments. The centered circular design emphasizes core messages while left-side bar labels enable precise numerical comparison and data accuracy.
-
How to Use
Ideal for executive reports, marketing strategy presentations, business performance briefings, and investor pitch decks. Simply input your existing data and the ratio visualization updates accordingly. Colors and label text are fully customizable to match corporate branding guidelines and presentation themes.
-
Recommended For
Marketing managers, business planning teams, financial analysts, executive presentation specialists, and management consultants presenting performance analysis and strategic planning. Particularly effective for multi-channel performance comparison and budget allocation decision-making processes.
-
Slide Structure
2-slide set. Each slide contains: title area at top, left-side vertical bar labels with 5 items (color-coded: lime green, black, gray segments), and centered donut chart (black outer ring, dark gray inner ring, lime green accent arc). 16:9 widescreen format, PPTX file type, fully editable.
Related Products
-

Car Donut Chart Presentation Template – Marketing Strategy
#Product/Service Introduction #Business Introduction #Marketing Plan and Strategy
-

Area Graph for Competitor Analysis
#Market and Competitor Analysis #Marketing Plan and Strategy #Graph
-

Donut Chart for Forest Preservation Rate – Strategy for Environmental Sustainability
#Business Strategy #Market and Competitor Analysis #Graph
-

Modern Wide PowerPoint Template Donut Chart - Visualizing Revenue Model
#Product/Service Introduction #Business Introduction #Diagram
