Performance Graph by Year – Results and Future Outlook
RJ0300017_4
- Last Update 04/22/2025
- File Size 0.2MB
- # of Slides 2
- File Format PPTX
- Slide Ratio 16:9
- Color
Keywords
- #Content-Based Slides
- #Design-Based Slides
- #Business Strategy
- #Market and Competitor Analysis
- #Graph
- #Achievements
- #Future Outlook
- #Circles
- #Doughnut Chart
- #16:9
- #doughnut chart PowerPoint
- #donut graph presentation slide
- #year-over-year performance chart
- #business metrics visualization
- #PowerPoint graph template download
About the Product
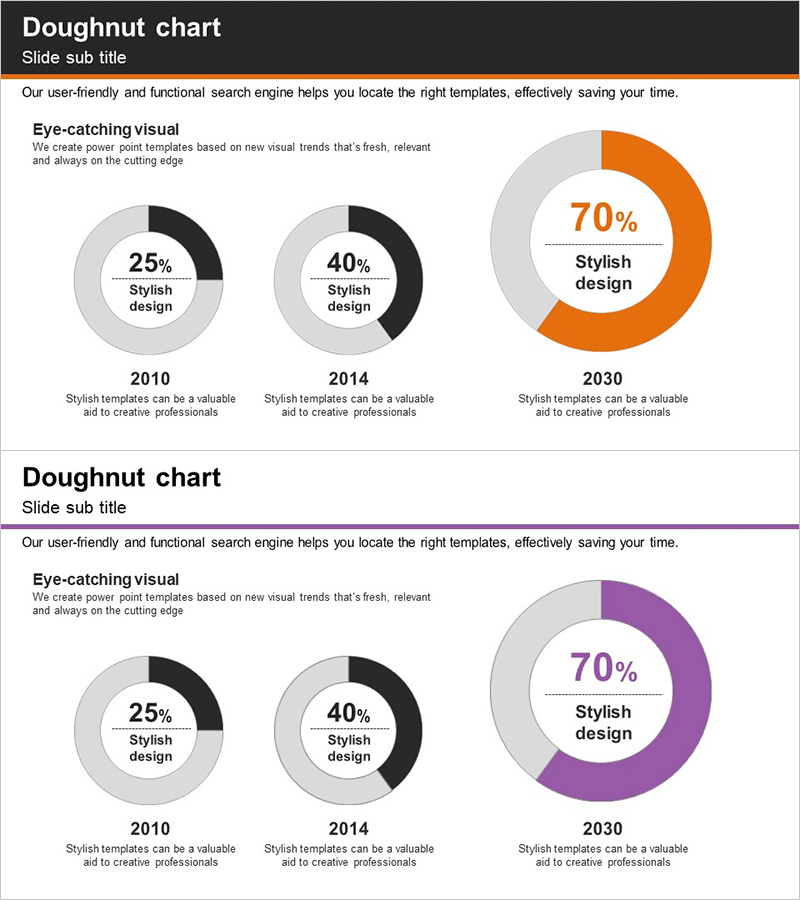
A 2-slide PowerPoint presentation featuring doughnut charts to visualize year-over-year performance metrics. The slides display performance data across three time periods (2010, 2014, 2030) using concentric doughnut rings in orange and black, or purple and gray color schemes. Each chart emphasizes key performance indicators with a central text area for highlighting critical figures. The 16:9 widescreen PPTX format ensures compatibility with modern presentation environments. Ideal for business performance reviews, market analysis reports, executive briefings, and strategic planning presentations where temporal performance trends need clear visual representation.
Usage Points
-
Main Usage
Visualize performance metrics across multiple time periods using concentric doughnut rings, enabling quick comparison of historical, current, and projected performance. The central text area allows emphasis of key figures, percentages, or strategic messages while maintaining visual clarity.
-
How to Use
Insert into executive briefings, quarterly business reviews, or annual performance reports in the metrics comparison section. Customize the central text with specific KPIs (revenue, customer satisfaction, market share), adjust ring percentages to match actual data, and modify colors to align with corporate branding guidelines.
-
Recommended For
Executives, business analysts, marketing managers, and financial professionals presenting performance trends to stakeholders. Particularly effective for investor presentations, shareholder meetings, board reports, and strategic planning sessions emphasizing long-term performance growth.
-
Slide Structure
Slide 1: Three orange-accented doughnut charts (25%, 40%, 70% data representation) with year labels (2010, 2014, 2030) and descriptive text. Slide 2: Identical layout with purple accent rings. Each doughnut comprises a gray background ring and colored emphasis ring with editable center circle for key metrics.
Related Products
-

Market Trends and Analysis Charts – Delivering Business Insights
#Business Strategy #Market and Competitor Analysis #Graph
-

Contribution of Environmental Factors to Growth – Donut Chart
#Business Strategy #Market and Competitor Analysis #Graph
-

Orange Green Rising Numerical Graph – Performance and Future Outlook
#Business Strategy #Market and Competitor Analysis #Graph
-

Comparison Bar Graphs and Core Doughnut Charts – Performance Analysis
#Business Introduction #Business Strategy #Graph
