Visualizing Key Achievements with Blue Line Donut Chart – Business Strategy
RJ0200066_21
- Last Update 04/18/2025
- File Size 1.3MB
- # of Slides 2
- File Format PPTX
- Slide Ratio 16:9
- Color
Keywords
About the Product
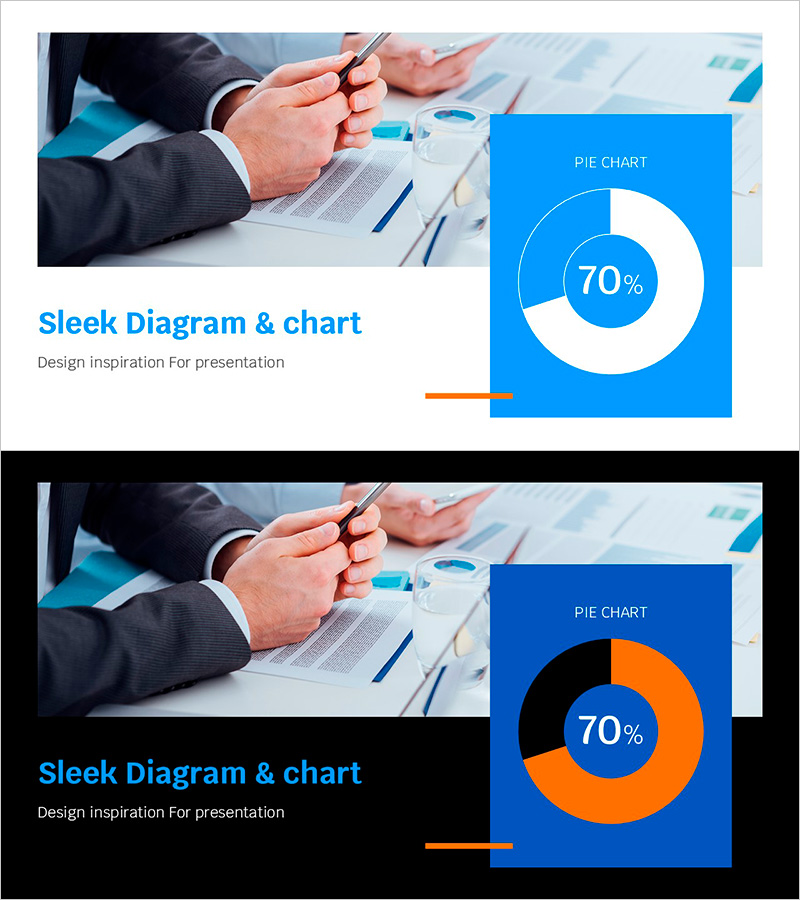
A professional donut chart PowerPoint slide designed to visualize business performance and goal achievement rates. The template features a bright blue background with white and orange donut graphs that clearly emphasize key metrics. Composed of 2 slides optimized for 16:9 widescreen format. Perfect for business strategy presentations, quarterly performance reports, and goal attainment rate displays. Each slide is fully editable, allowing you to customize numbers, labels, and colors to match your organization's branding and data requirements.
Usage Points
-
Main Usage
Ideal for comparing two ratio metrics simultaneously, such as quarterly achievement rates, actual results versus targets, and business progress percentages. The 70% center display emphasizes the primary metric, while the outer ring color segments communicate composition ratios intuitively.
-
How to Use
Use in executive reports, quarterly performance presentations, and business plan review meetings to visualize achievement rates and results. Customize the numbers, labels, and colors to match your organization's brand identity and adapt the slides to various presentation scenarios.
-
Recommended For
Recommended for executives, business managers, marketing teams, and project managers who need to report and justify quantitative performance metrics. Particularly effective for quarterly and annual performance reviews, investor reports, and internal management meetings.
-
Slide Structure
Slide 1: Blue background with white donut graph (70% center display) and orange accent ring. Slide 2: Blue background with orange donut graph (70% center display) and black accent ring. Each slide includes a title area, donut chart area, and legend with descriptive text sections.
Related Products
-

Achievement Rate Donut Chart – A Visual Tool for Business Performance
#Company Introduction #Business Strategy #Graph
-

Premium Management Presentation – Pie Business Model
#Company Introduction #Financial Plans and Performance #Graph
-

Geometry PowerPoint Template Wide Donut Chart1
#Company Introduction #Product/Service Introduction #Graph
-

Performance Analysis Graph by Field – Visualizing Business Performance
#Business Strategy #Market and Competitor Analysis #Graph
