Step-by-Step Plan for Business Execution – Effective Execution Diagram
RB0100071_9
- Last Update 03/07/2025
- File Size 1.5MB
- # of Slides 2
- File Format PPTX
- Slide Ratio 4:3
- Color
Keywords
About the Product
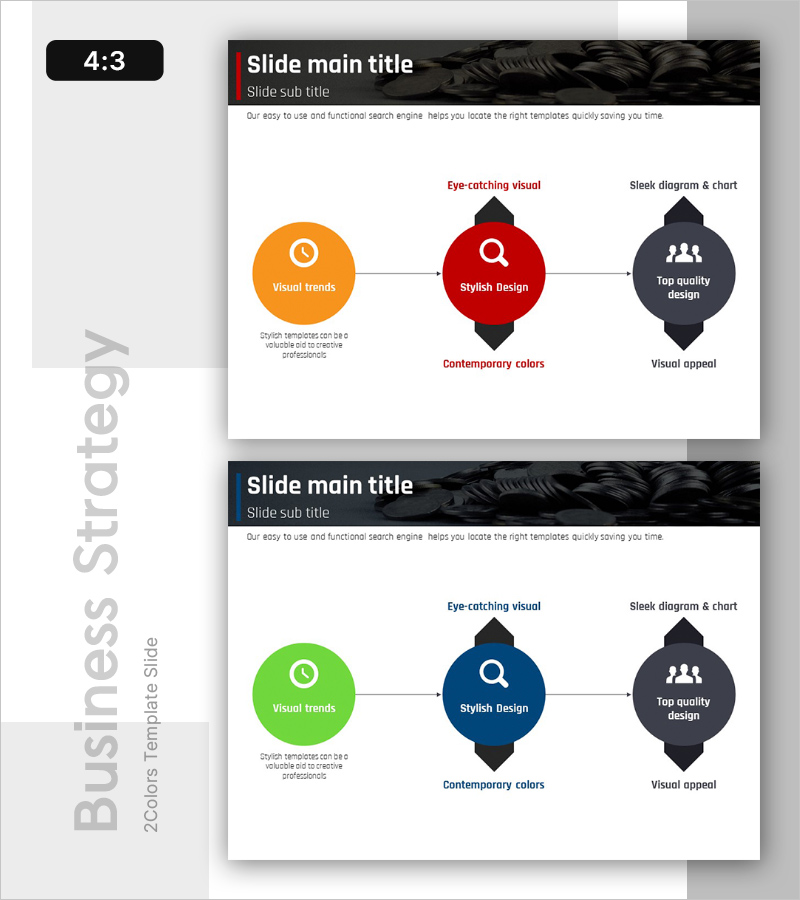
A 3-node connected diagram PowerPoint slide that visualizes business execution stages in sequential flow. The design features circular nodes in orange, red, and dark gray connected by arrows, each representing a key execution element (Visual Trends, Stylish Design, Top quality design). Two slide variations provide color options (orange-red-dark gray and green-blue-dark gray) to match your presentation context. This PPT diagram slide is ideal for business strategy presentations, process flow documentation, and execution plan briefings.
Usage Points
-
Main Usage
Visualize a 3-stage business execution flow to effectively communicate strategy direction, implementation plans, and progress updates. Each node combines icons and text labels to clearly distinguish stage objectives, activities, and outcomes in executive presentations.
-
How to Use
Use this slide in business strategy presentations, management briefings, and project kickoff meetings to explain execution stages sequentially. Edit node text and icons to match your organization's actual execution phases, and select the color variant that best fits your presentation tone.
-
Recommended For
Ideal for executives, business managers, project managers, and marketing strategists presenting business execution progress, strategic direction, and implementation plans. Particularly effective in business plans, management reports, and strategy presentations emphasizing 3-stage processes.
-
Slide Structure
Three circular nodes connected left-to-right with directional arrows. Each node contains an icon (clock, magnifying glass, people icon) and text label, with descriptive text area below. Both slides maintain identical structure with color variations (orange-red-dark gray and green-blue-dark gray).
Related Products
-

Weather Flow Direction Diagram – Business Strategy Presentation
#Business Strategy #Diagram #Business Direction
-

Premium Idea Strategy Slide - Business Progress for Awards
#Business Strategy #Diagram #Business Direction
-

Business Progress Stage Process Visualization - Progress and Direction
#Business Strategy #Diagram #Business Direction
-

Sheep and Progress Diagram – Effective Business Direction
#Business Strategy #Diagram #Business Direction
