Business Progress Stage Process Visualization - Progress and Direction
RB0800024_19
- Last Update 03/22/2025
- File Size 1.5MB
- # of Slides 2
- File Format PPTX
- Slide Ratio 4:3
- Color
Keywords
- #Content-Based Slides
- #Design-Based Slides
- #Business Strategy
- #Diagram
- #Business Direction
- #Flow
- #Cluster
- #Linear Flow
- #Closed Cluster Diagram
- #Project Progress
- #4:3
- #circular process diagram PowerPoint
- #business progress flow slide
- #4-stage diagram template
- #process visualization PowerPoint
- #how to create process diagram in PowerPoint
About the Product
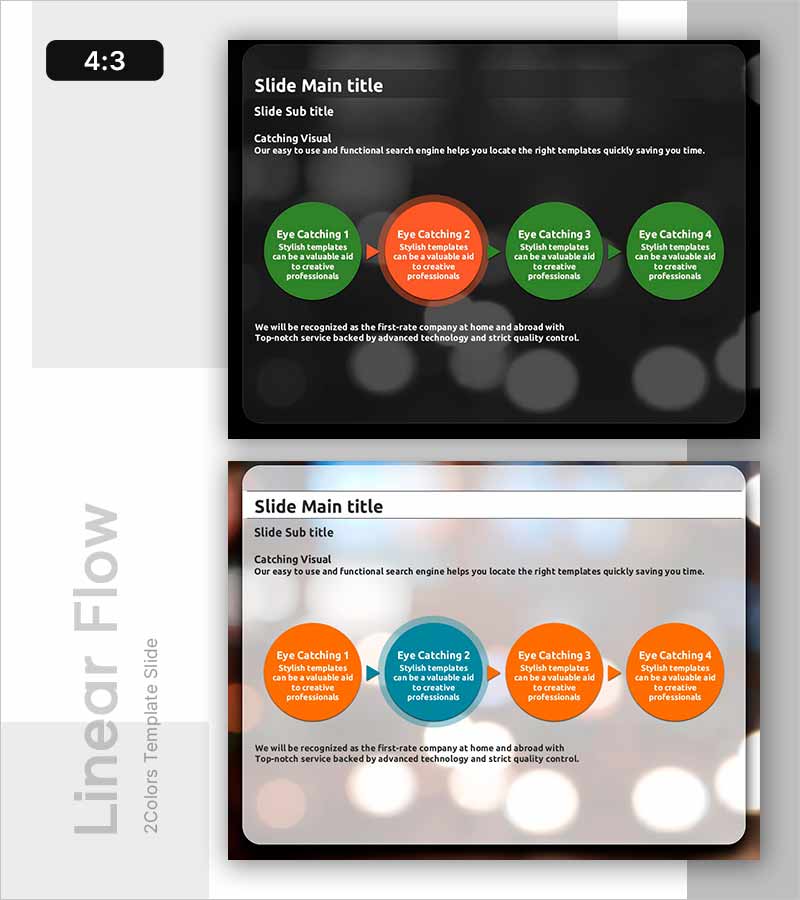
A circular process diagram PowerPoint slide that visualizes business progress stages through four interconnected circular nodes. The design features green and orange nodes connected by directional arrows on a dark background, clearly showing workflow progression and sequential direction. Includes two layout variations (dark and light backgrounds) for flexible integration into different presentation documents. Each node accommodates title and descriptive text, making it ideal for illustrating project milestones, business advancement phases, operational workflows, and strategic progression.
Usage Points
-
Main Usage
Visualizes business progress stages, project advancement phases, operational workflows, and cyclical processes across four sequential steps. Color differentiation (green-orange-green-green) highlights key stages, while directional arrows clarify progression and relationships between phases, enabling clear communication of business momentum and strategic direction.
-
How to Use
Insert into business reports, project proposals, or marketing plans within 'Implementation Strategy' or 'Execution Timeline' sections. Customize each circular node with stage names (Stage 1–4) and supporting details. Adjust node colors to emphasize priority levels as needed. Select dark or light background version to match presentation tone and corporate branding.
-
Recommended For
Executive presentations reporting business progress, team meetings discussing project advancement, management briefings on new business initiatives, marketing professionals illustrating campaign execution phases, and operations leaders communicating workflow progression to stakeholders.
-
Slide Structure
Four circular nodes (approximately 80px diameter) arranged horizontally left-to-right, connected by orange directional arrows (approximately 40px length). Each node contains title field (12pt bold) and descriptive text area (10pt). Header section includes main title and subtitle; footer provides additional context text, creating comprehensive visual narrative of business progression.
Related Products
-

Premium Idea Strategy Slide - Business Progress for Awards
#Business Strategy #Diagram #Business Direction
-

Sheep and Progress Diagram – Effective Business Direction
#Business Strategy #Diagram #Business Direction
-

Camping Itinerary System Diagram – Clear Business Direction
#Business Strategy #Diagram #Business Direction
-

Strategy and Step Diagram – Infographic for Business Direction
#Business Strategy #Diagram #Step-by-Step Schedule Plan
