Financial Presentation Template – Modern and Stylish Design
B0100071
- Last Update 01/01/2025
- File Size 9.7MB
- # of Slides 35
- File Format PPTX
- Slide Ratio 4:3
- Color
Slide Preview
Keywords
About the Product
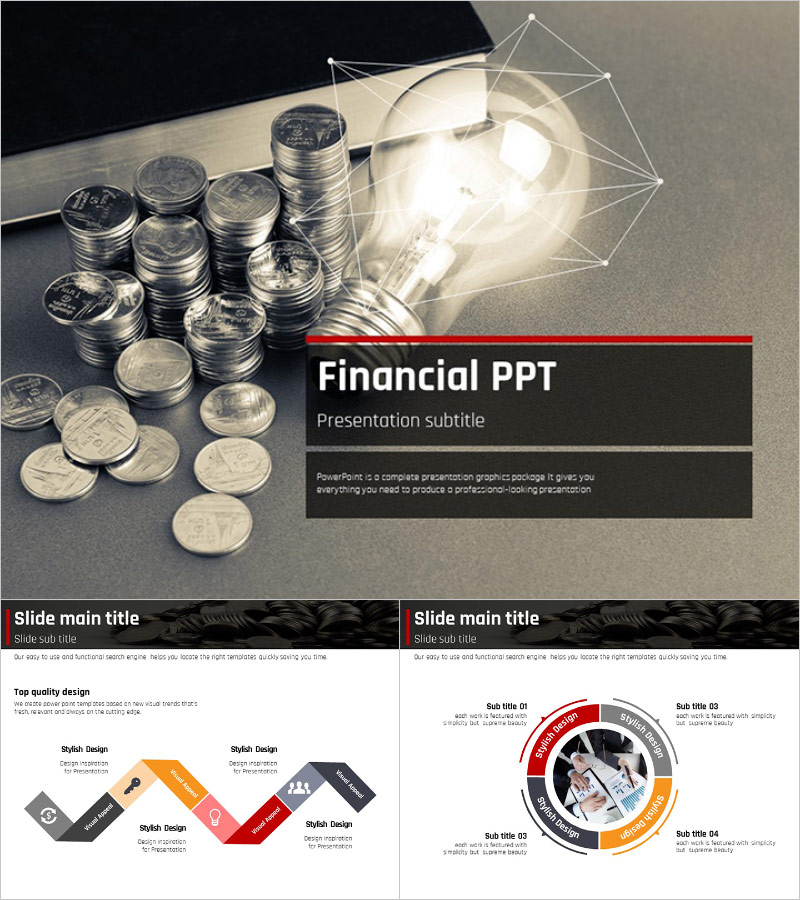
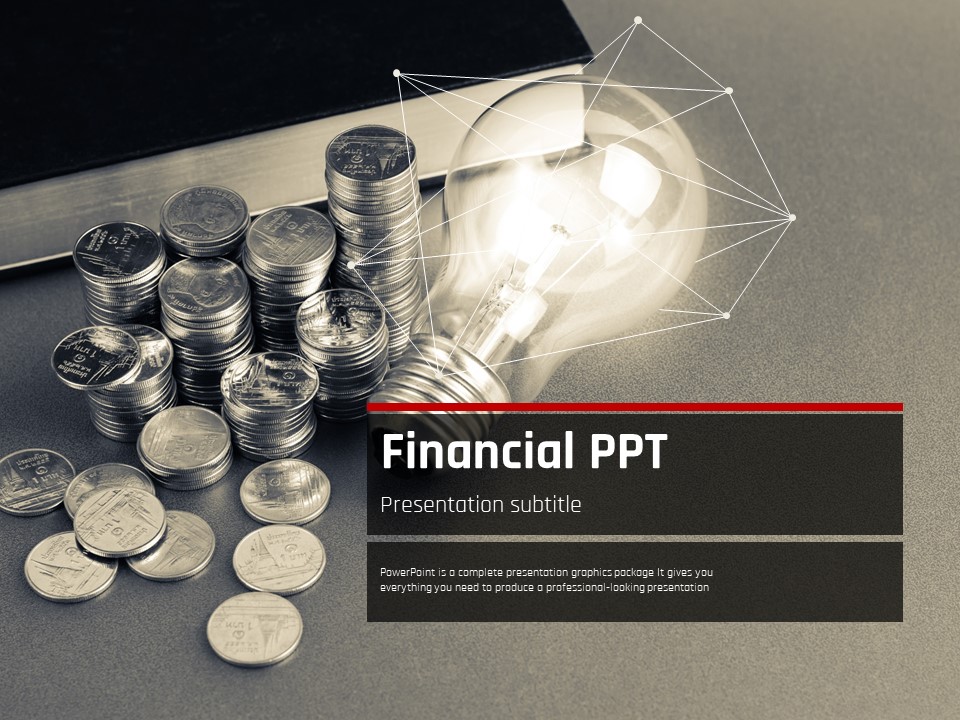
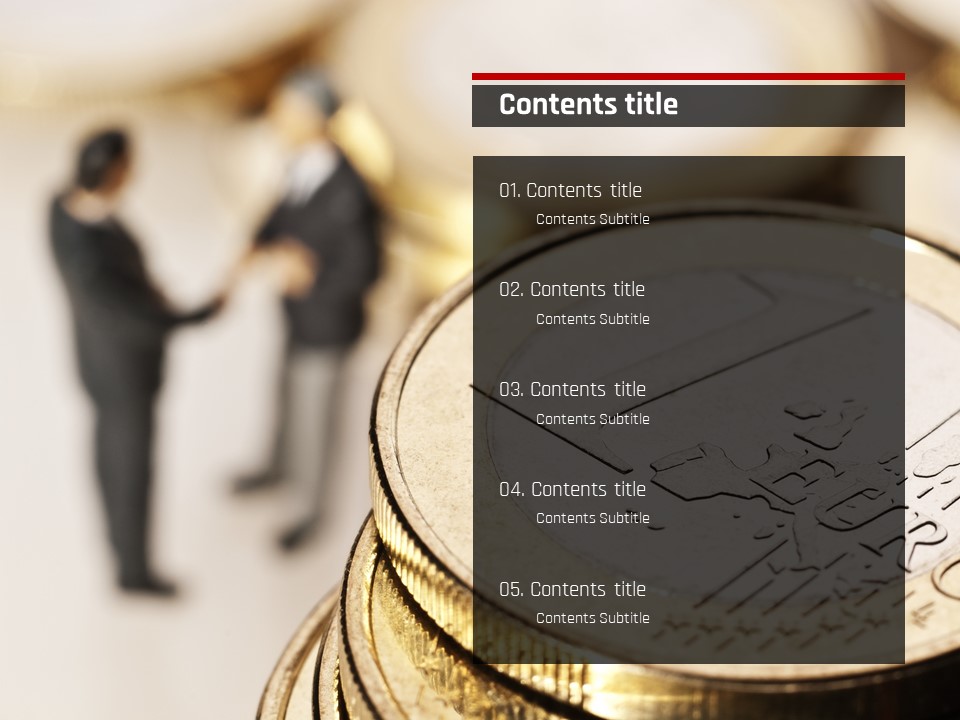
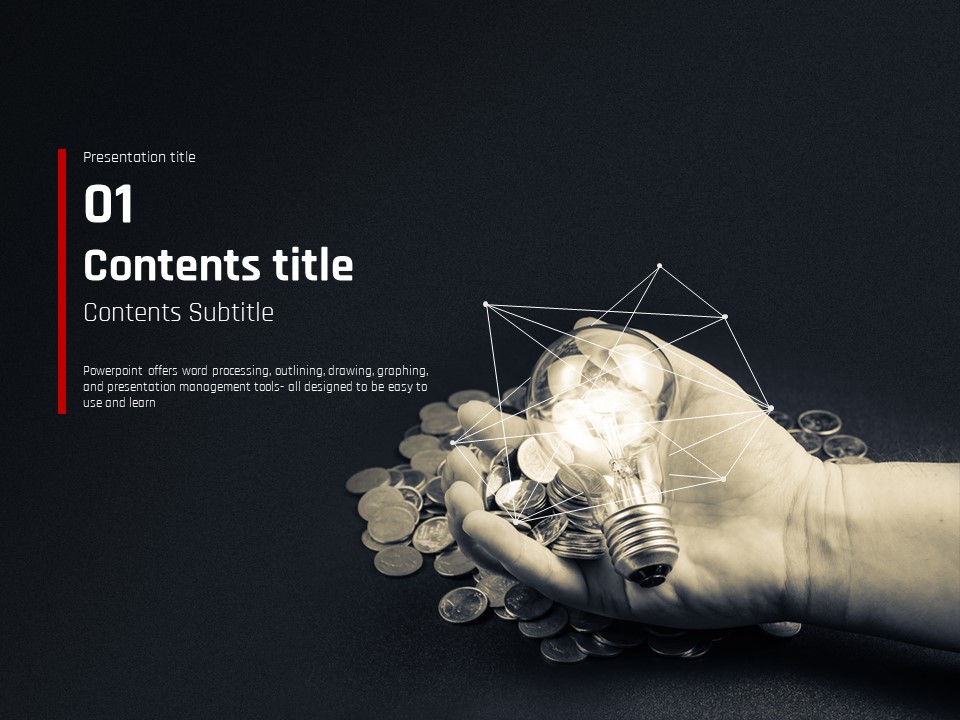
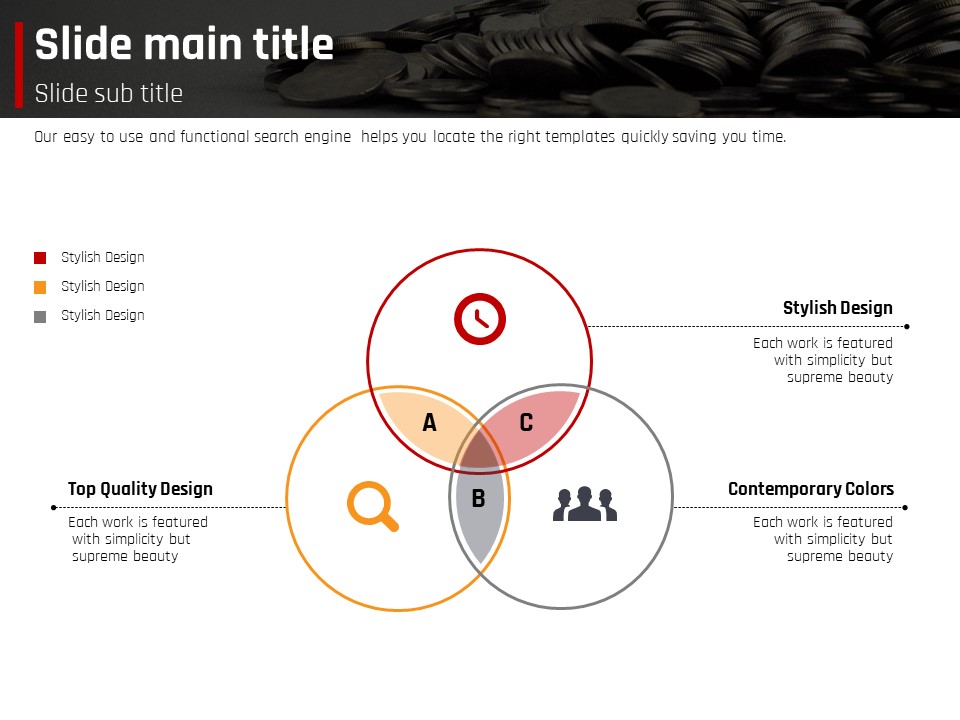
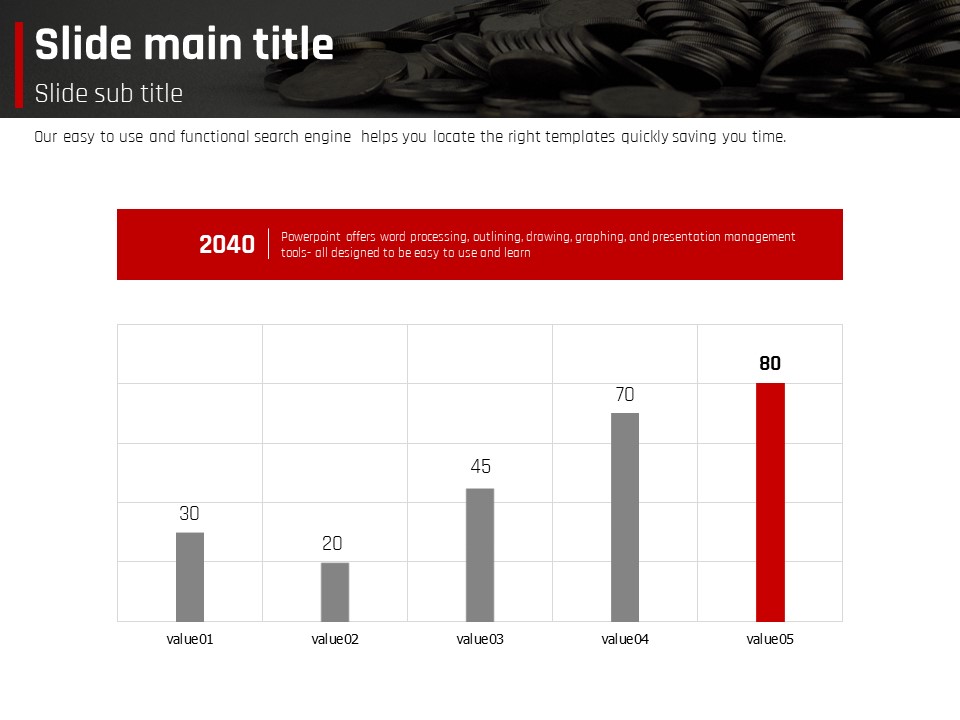
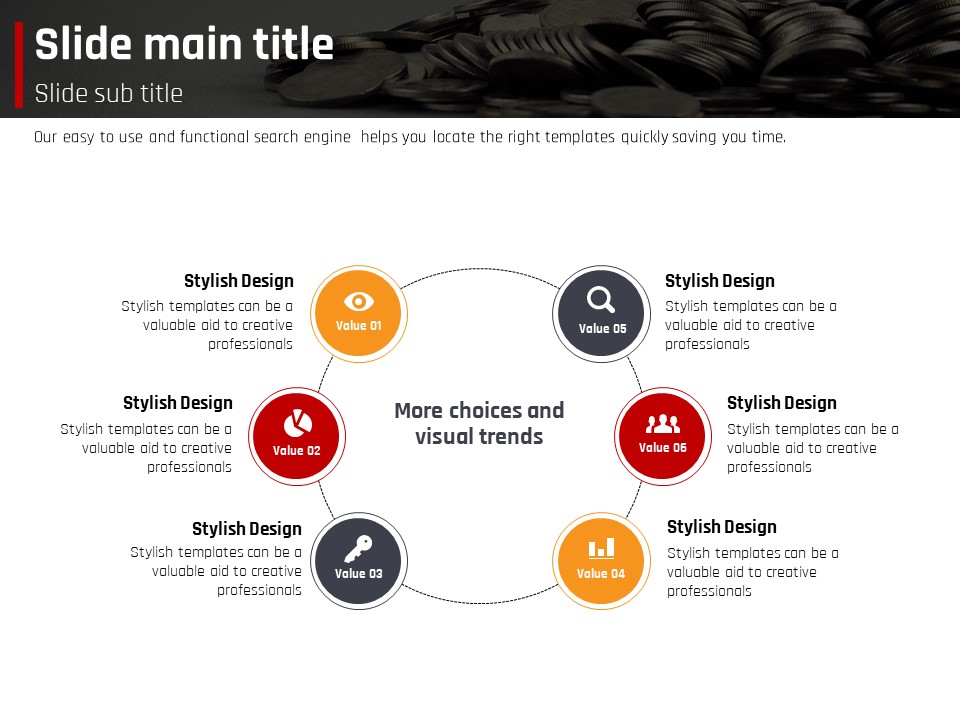
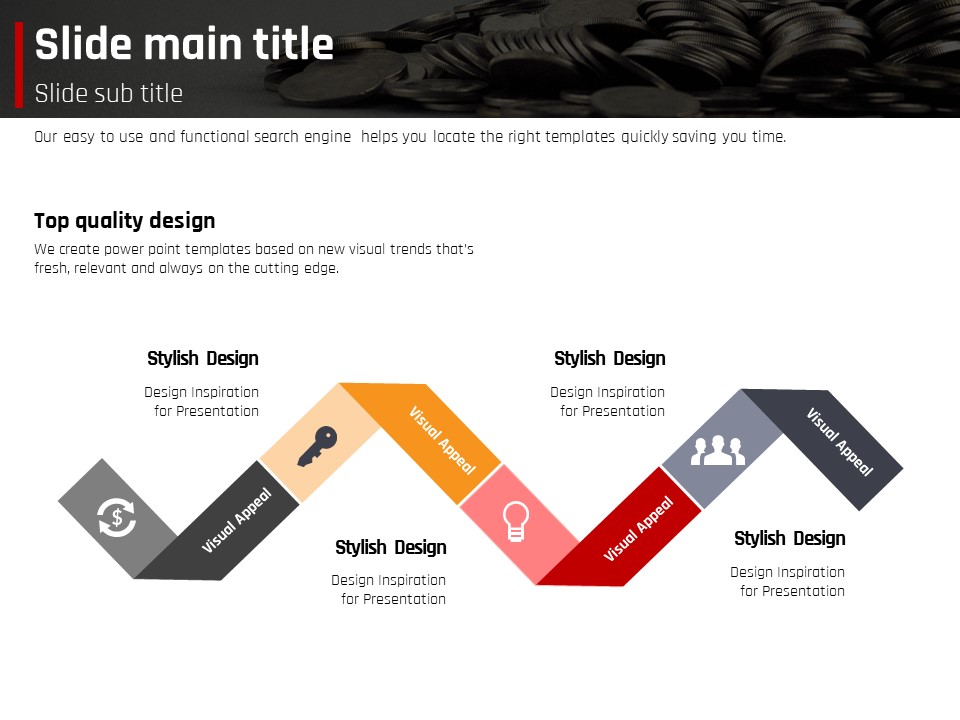
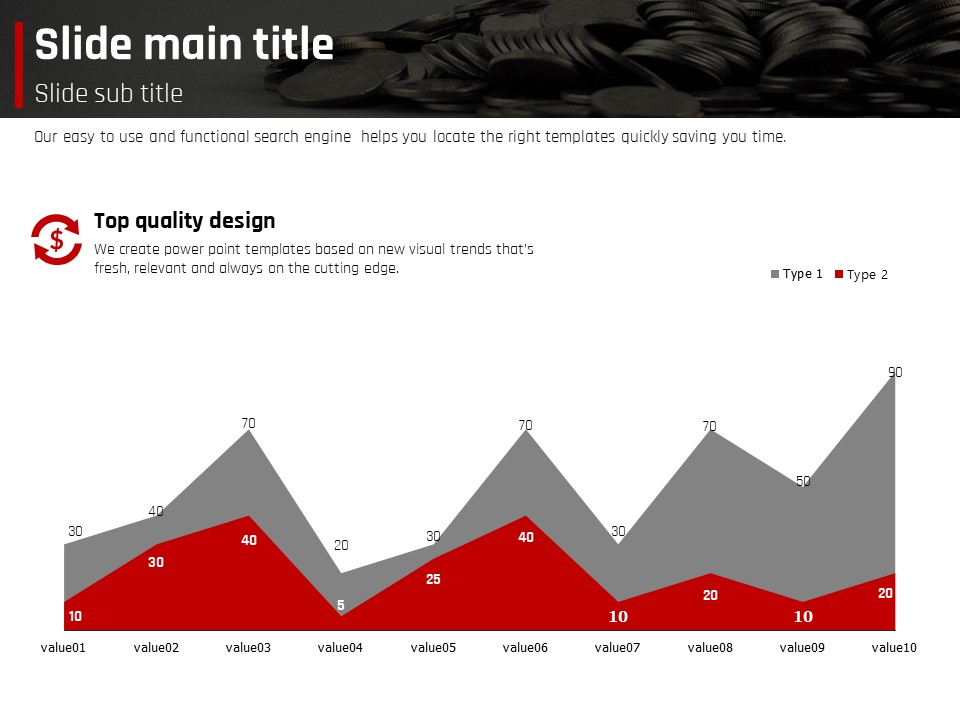
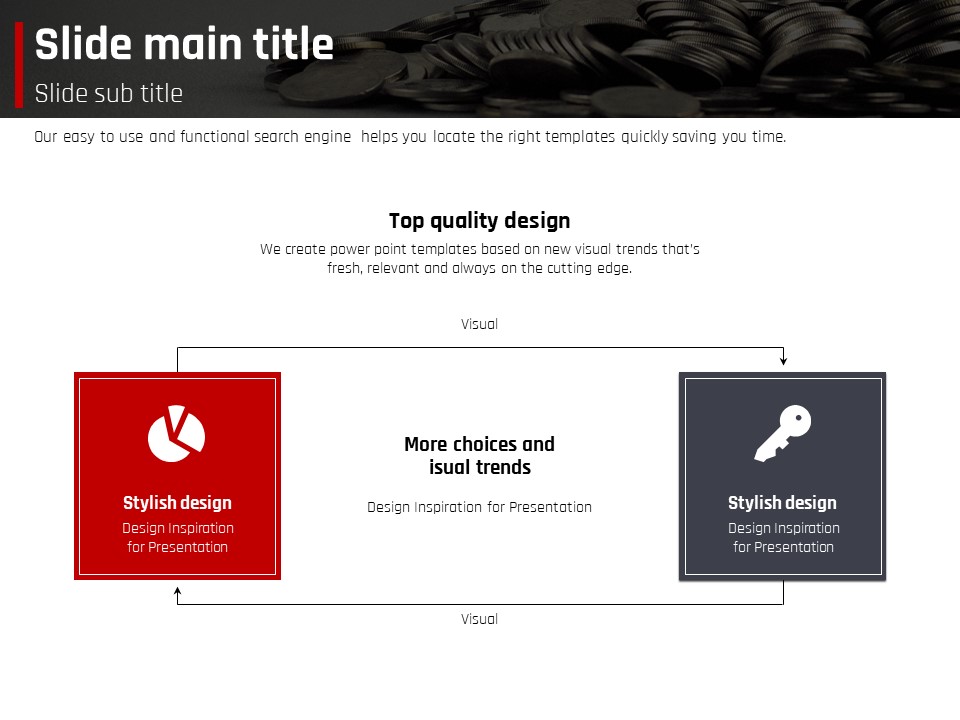
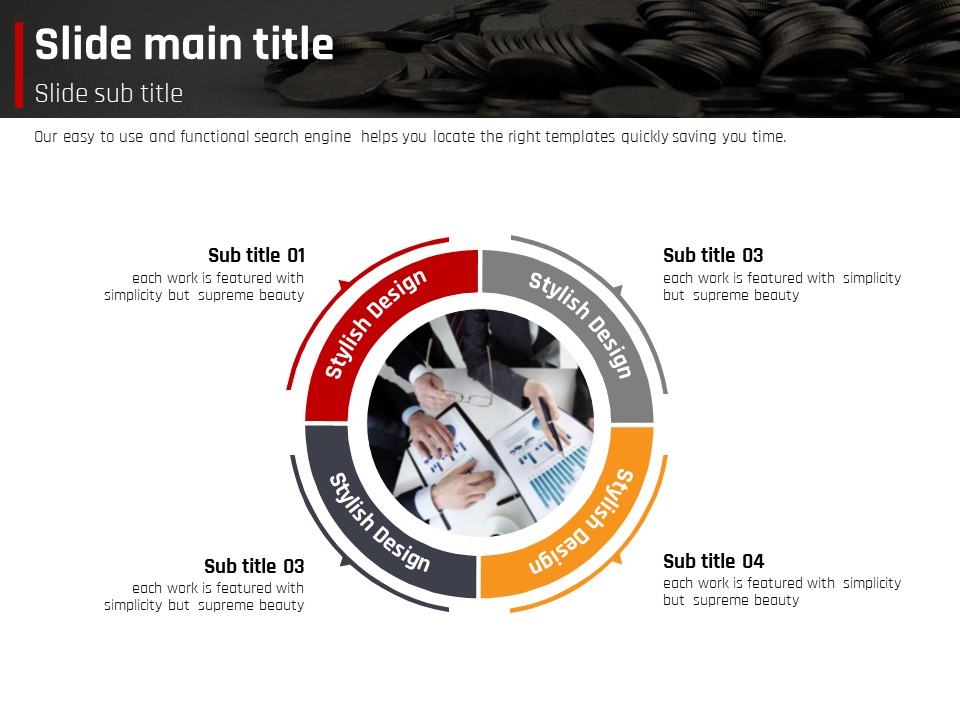
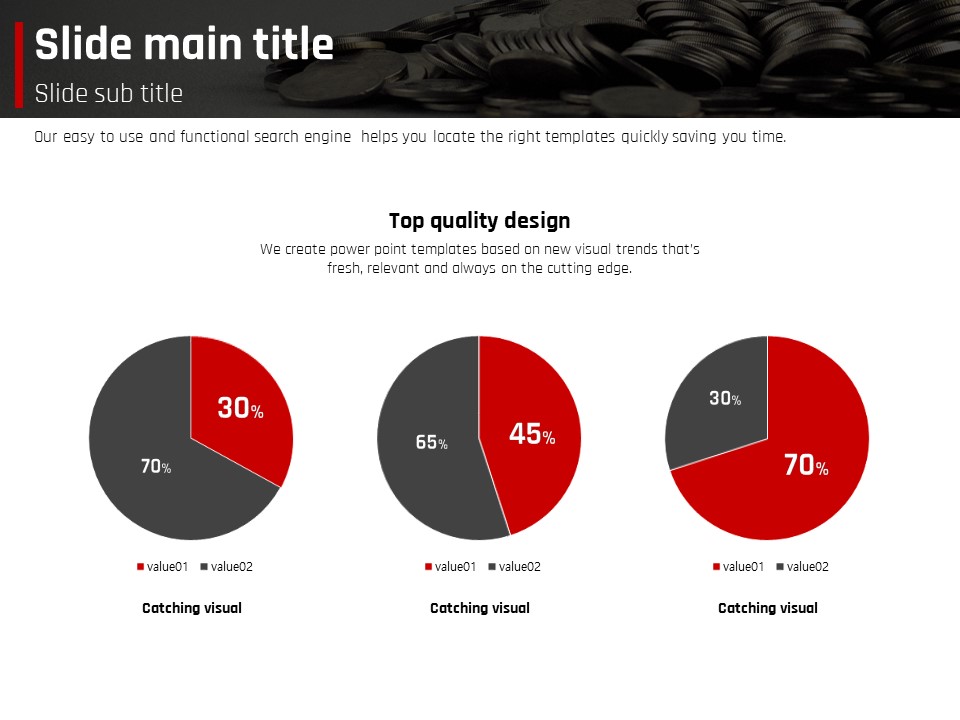
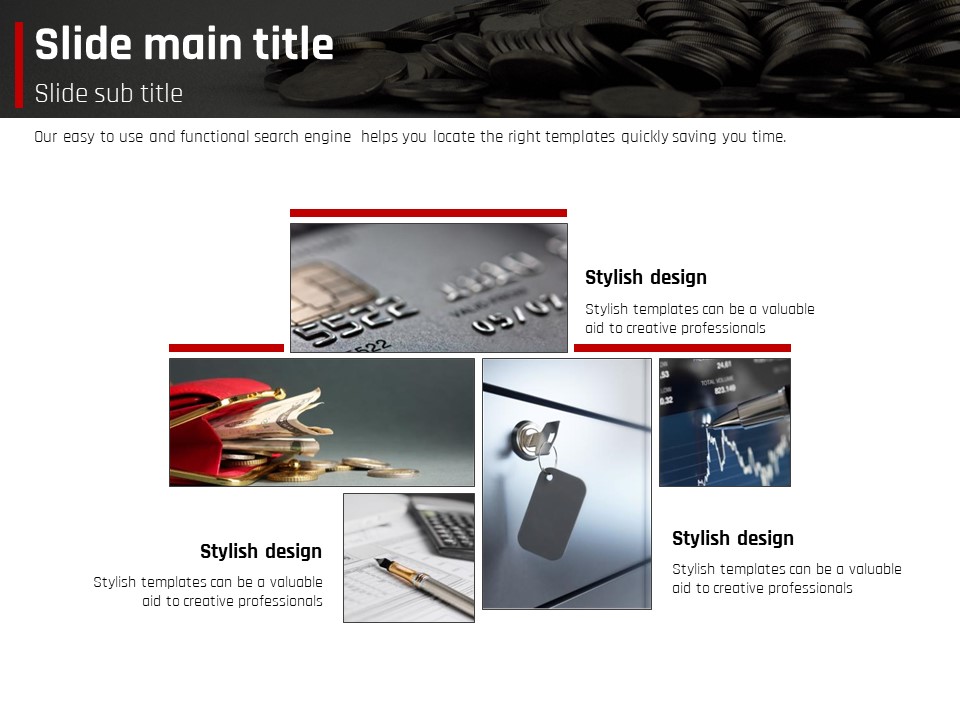
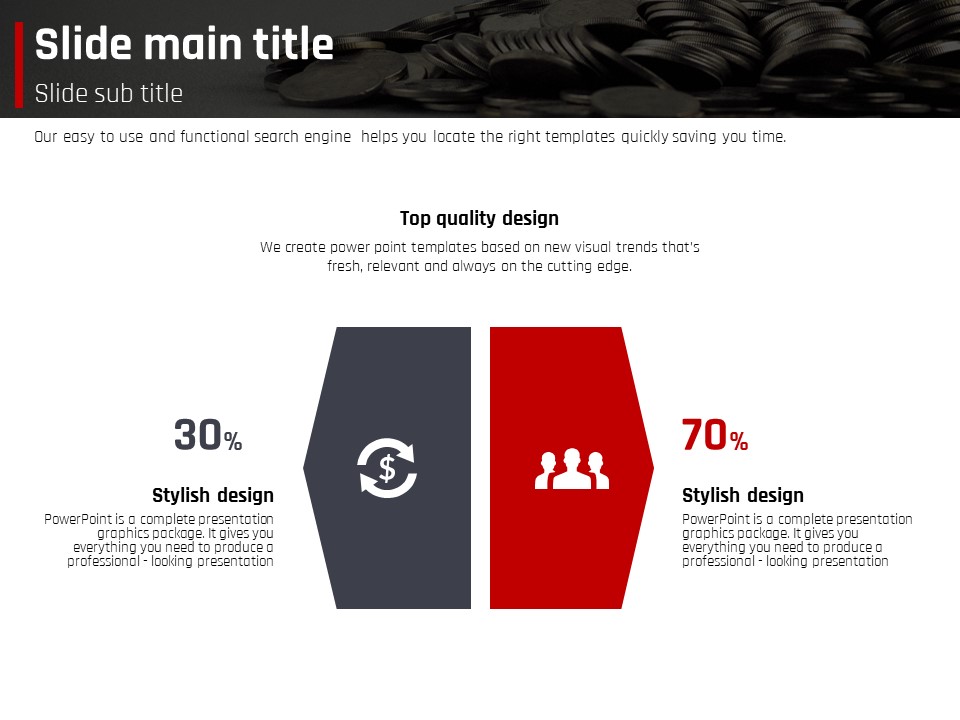
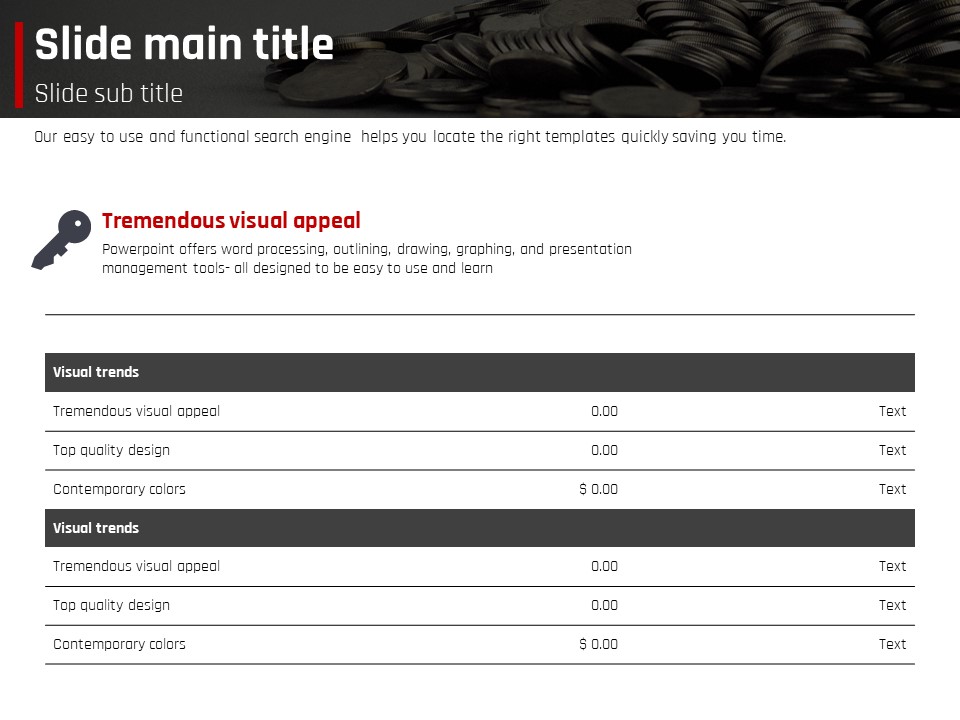
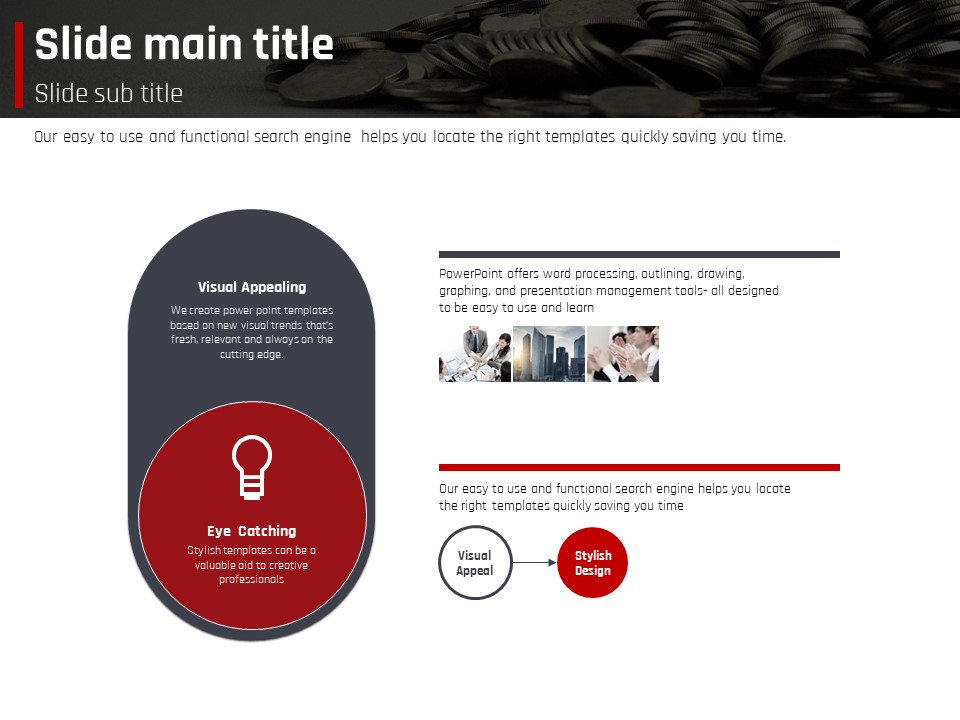
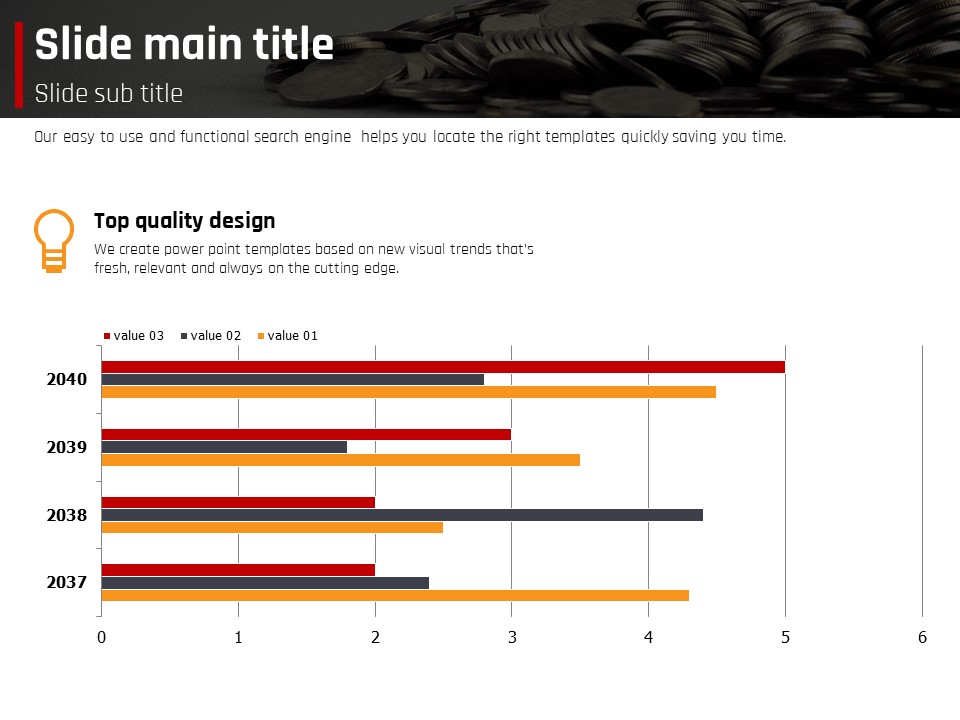
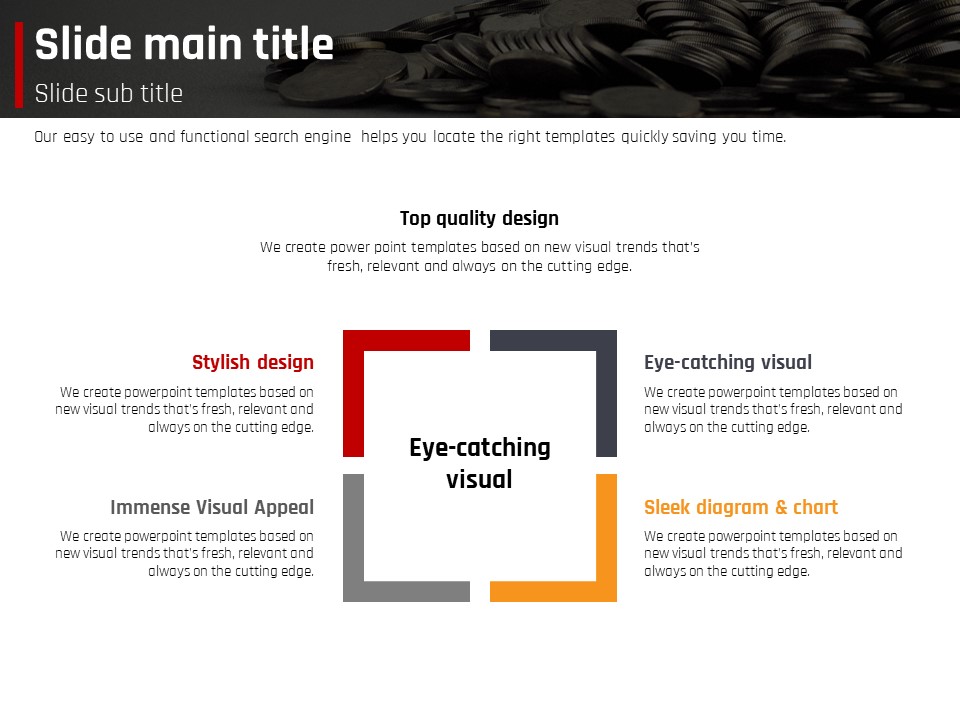
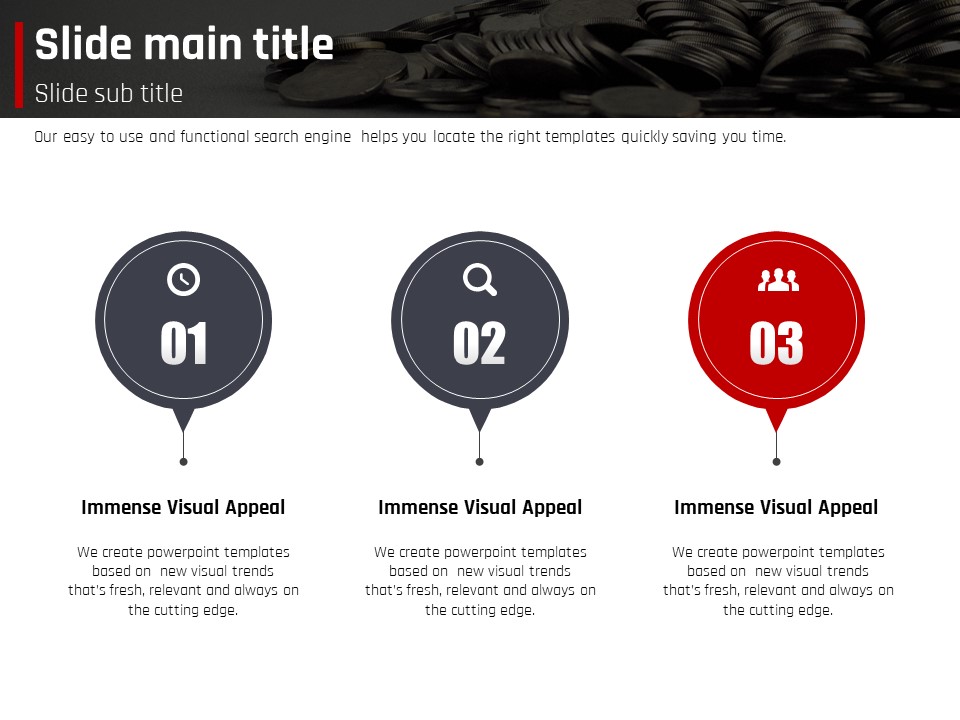
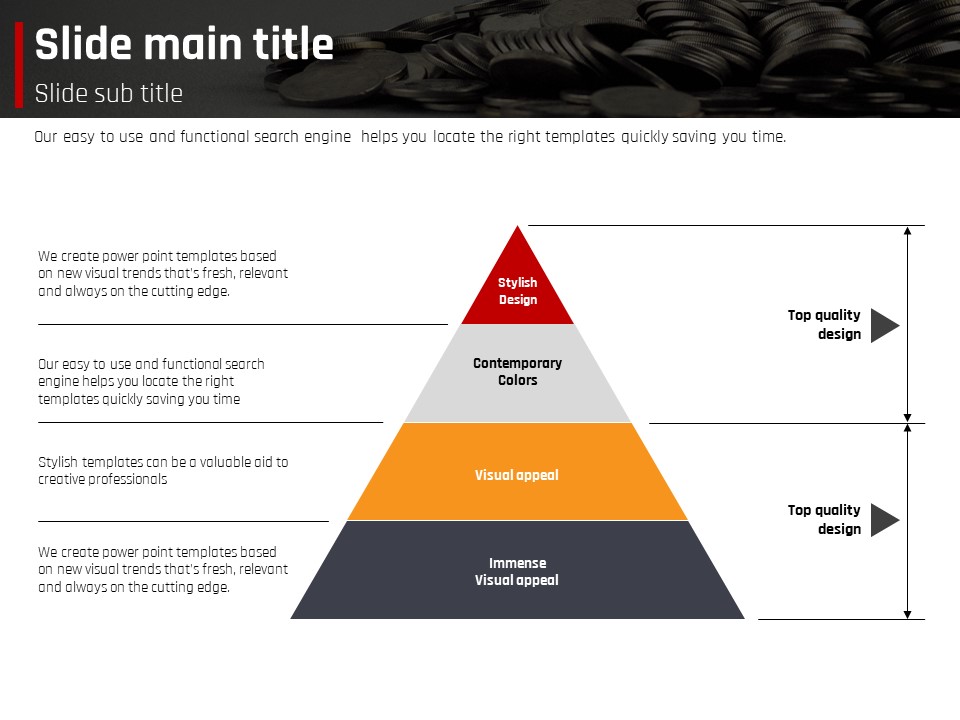
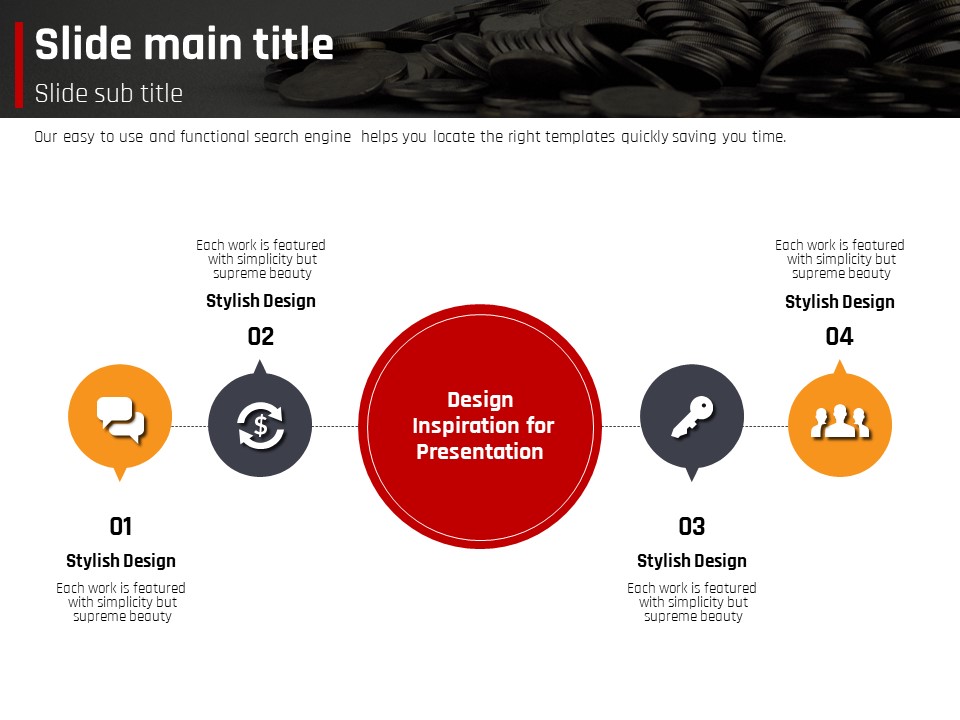
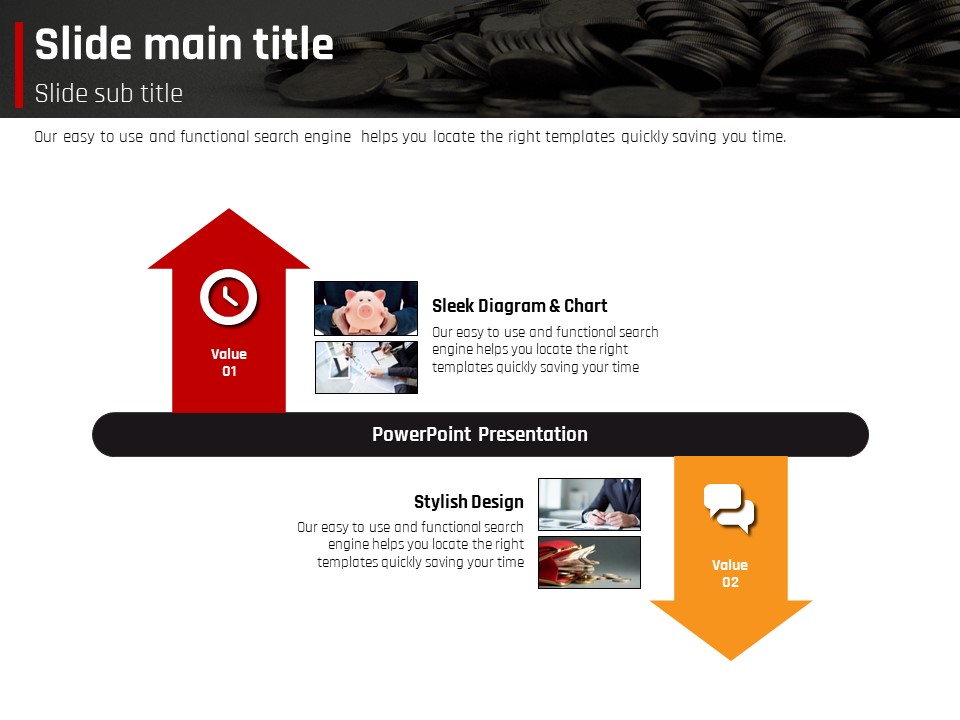
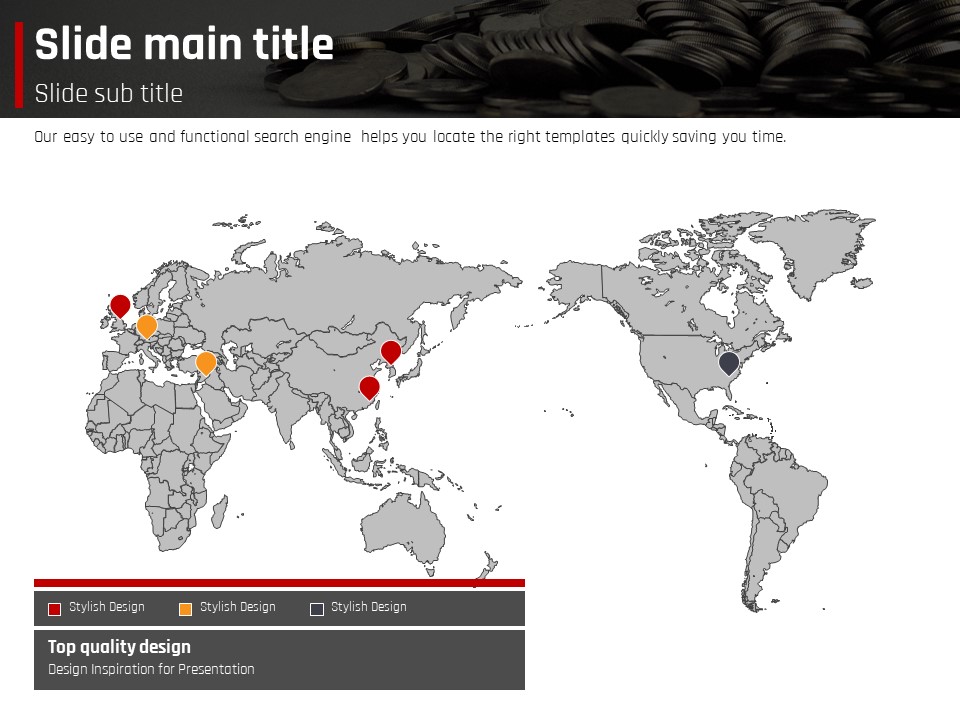
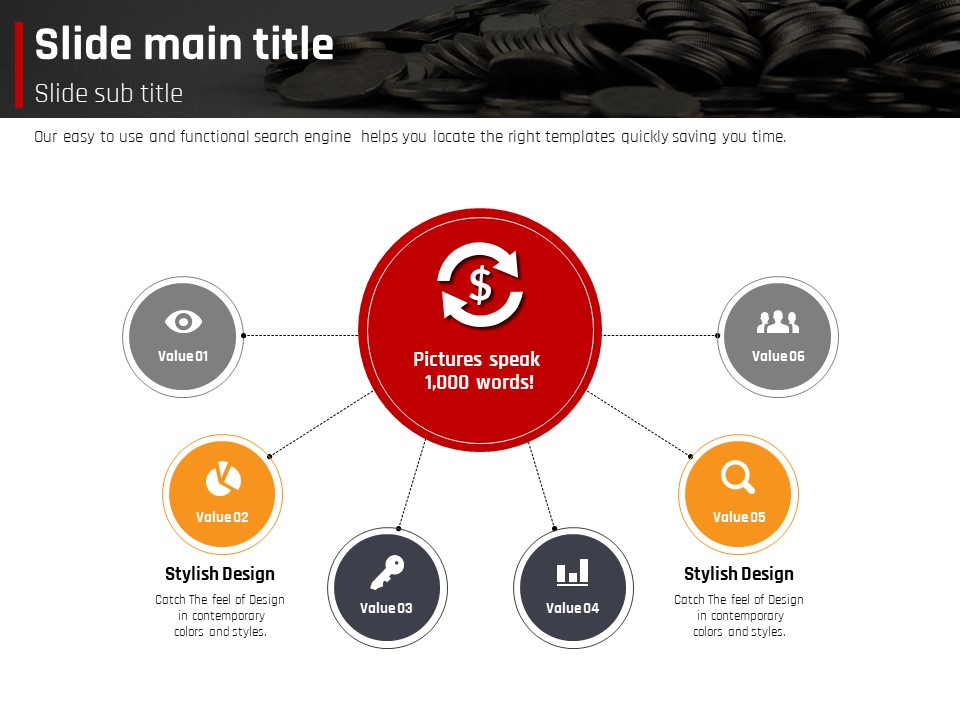
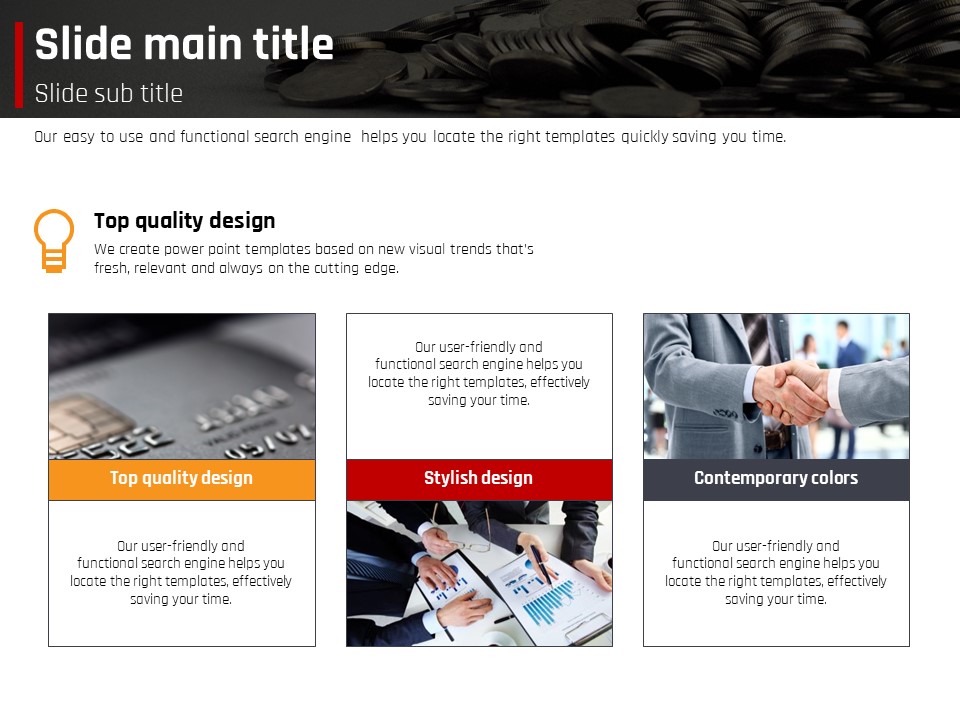
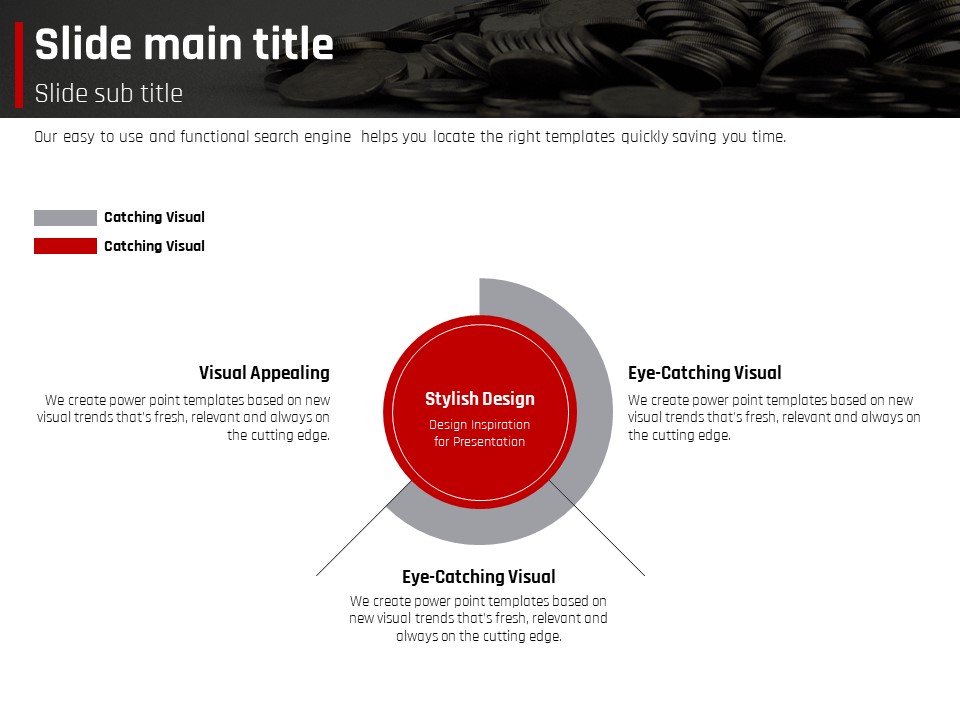
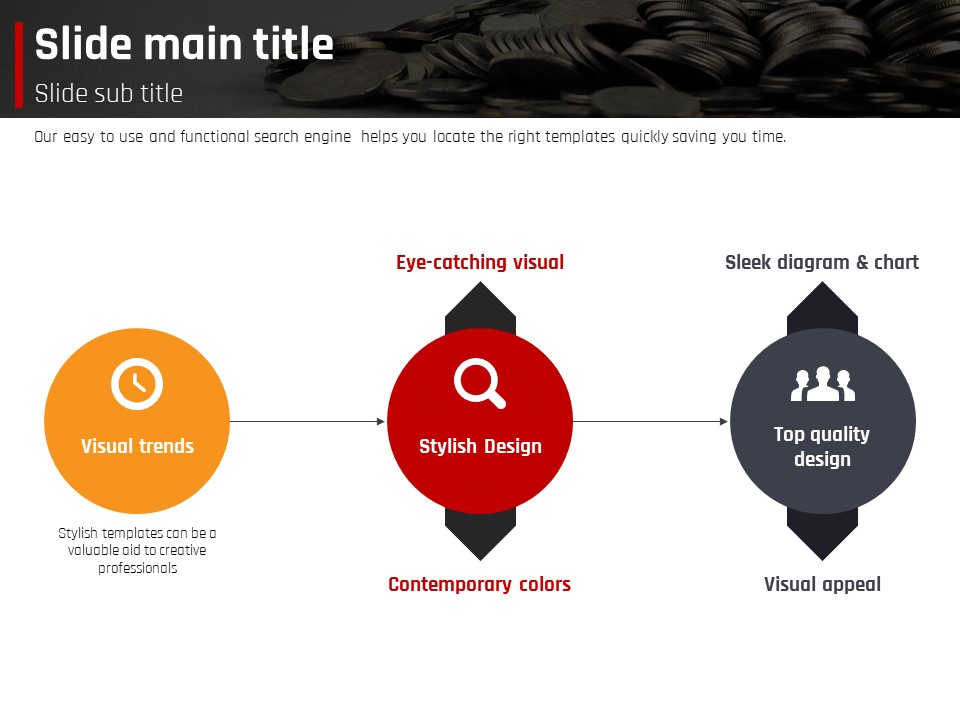
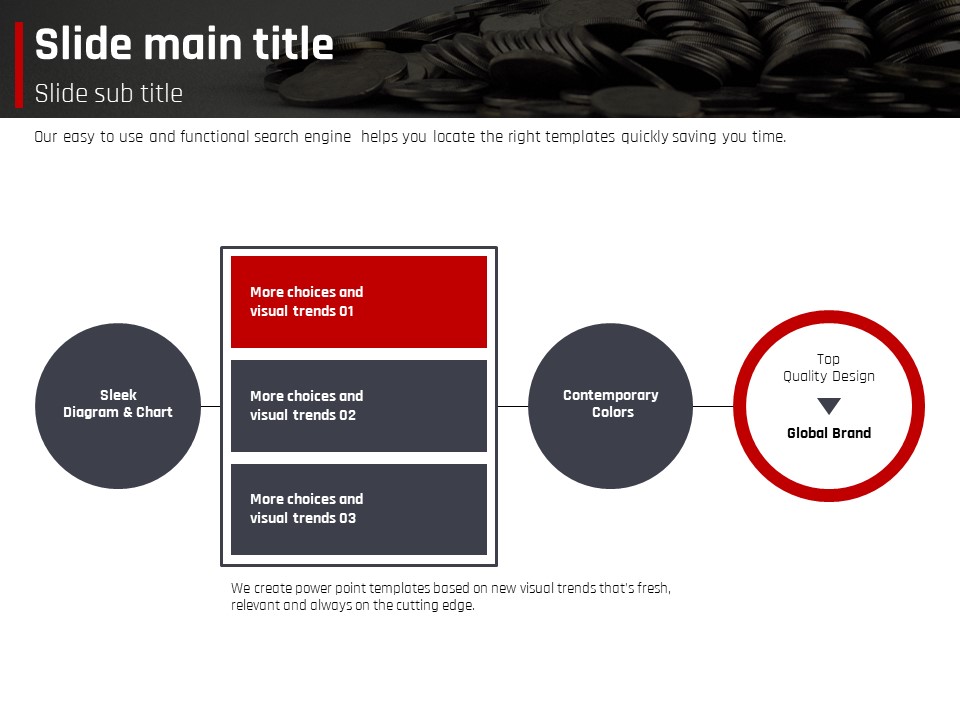
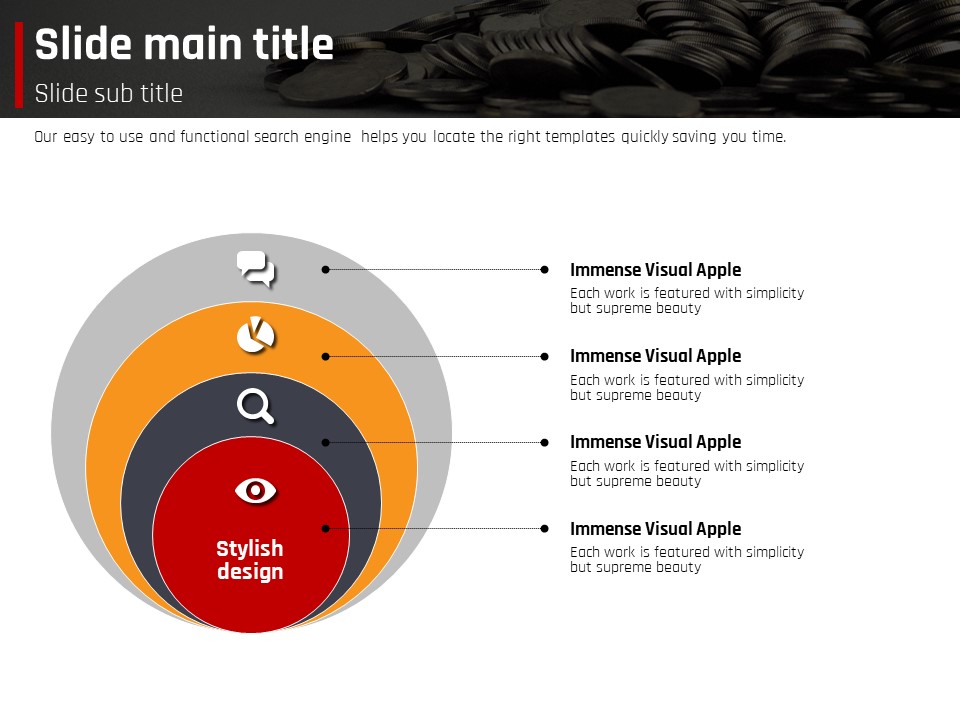
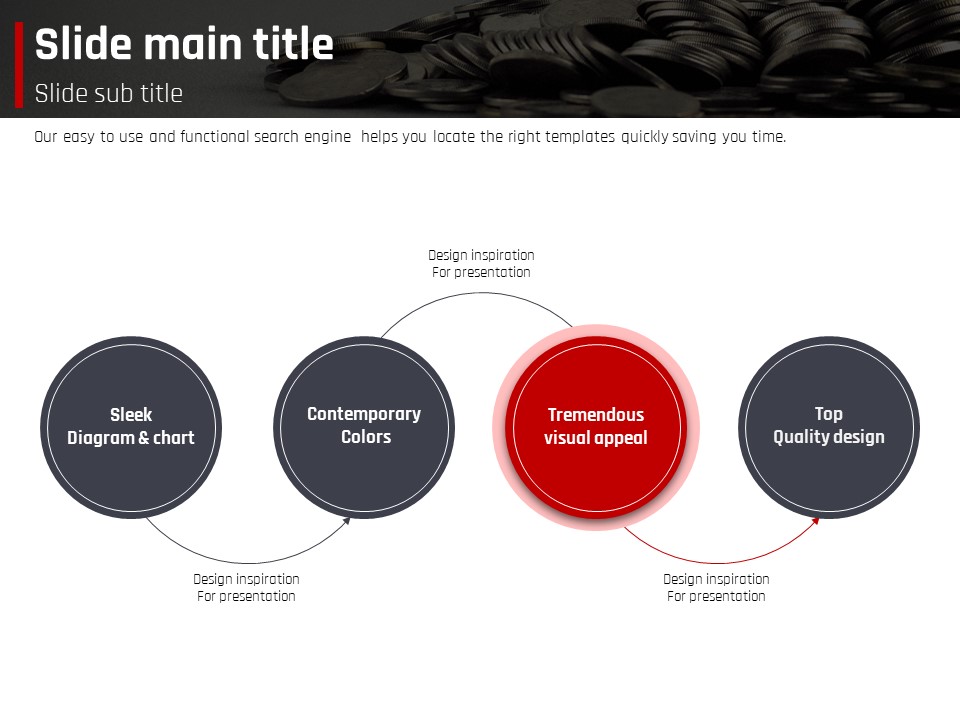
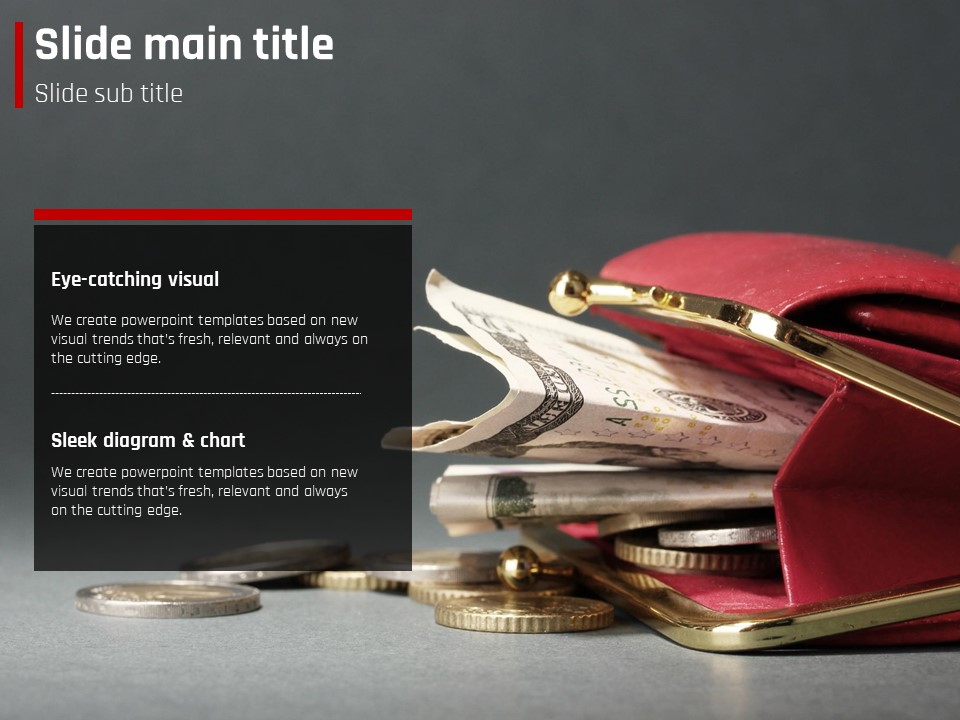
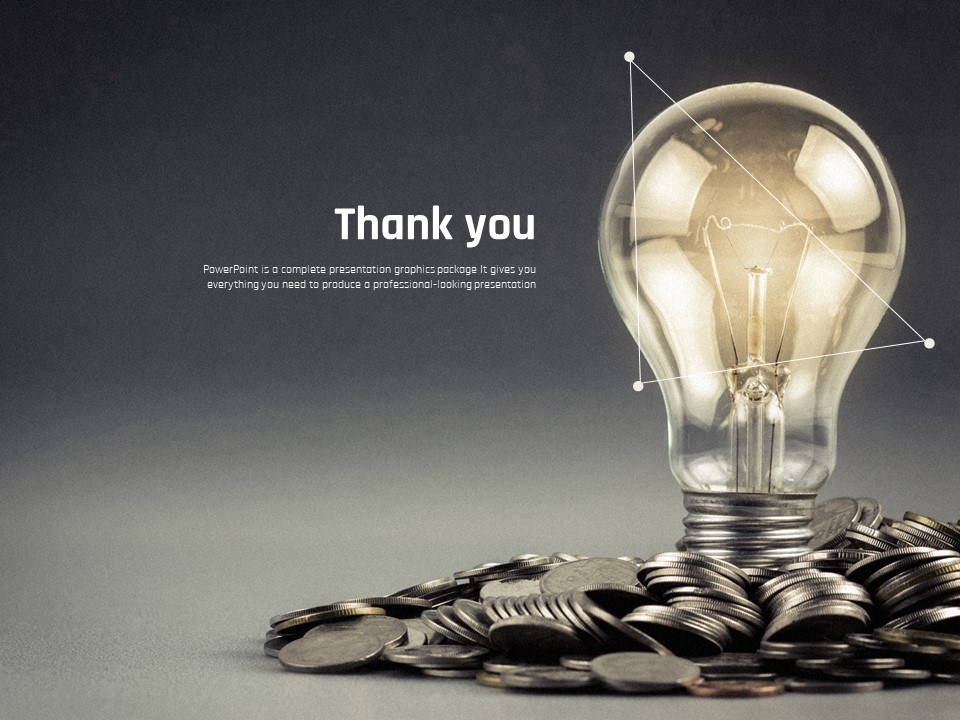
A professional PowerPoint template designed for financial and economic presentations, featuring a dramatic cover with coin and lightbulb photography overlaid on a dark charcoal background with bold red accent colors. This 35-slide deck includes a full range of slides essential for financial reporting: a high-impact cover slide, a 4-segment circular flow diagram in red, charcoal, orange, and gray, a 4-icon parallel layout for key message delivery, and a 3-panel pie chart comparison slide for ratio visualization. The strong contrast between the dark background and white typography ensures your data stands out in boardroom presentations and investor briefings. Provided in fully editable PPTX format at 4:3 ratio, all text, chart values, and color accents can be customized to match your brand or reporting requirements.
Usage Points
-
Main Usage
Designed for financial analysts, IR teams, and consultants who need to deliver investment reports, quarterly earnings presentations, or economic trend briefings with a high-impact, data-driven visual style.
-
How to Use
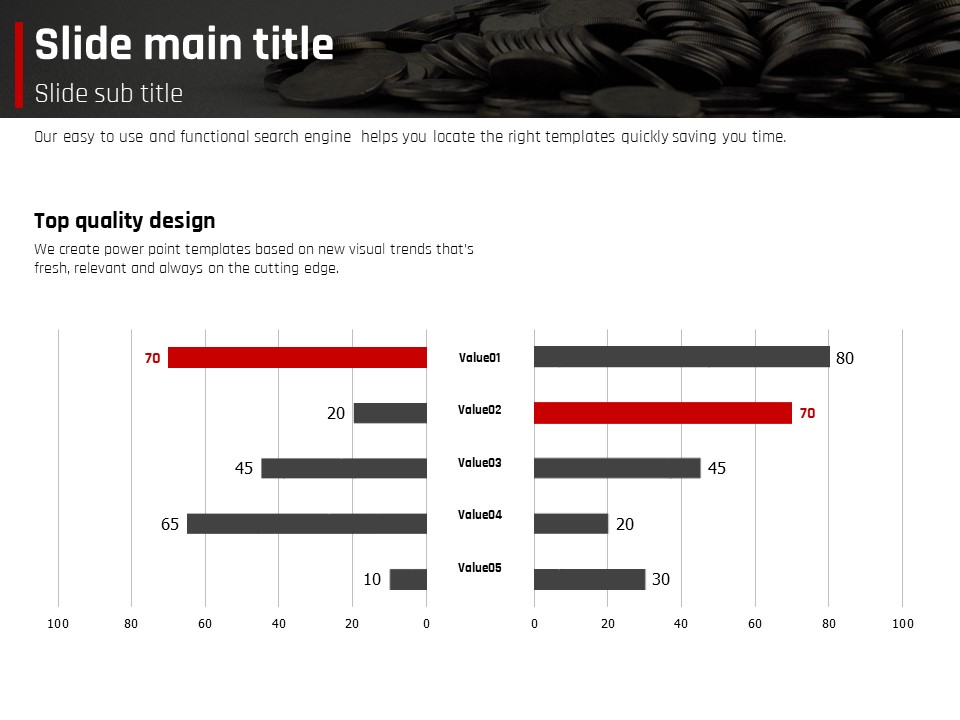
Download the PPTX file and open it directly in PowerPoint. Replace placeholder text and chart values with your own financial data. The pie chart slides update automatically when you input new figures, making it easy to visualize ratios and financial breakdowns.
-
Recommended For
Best suited for financial institutions, securities firms, consulting agencies, and corporate finance teams. Ideal for analysts and IR managers who need to present data-heavy reports in a clear, authoritative format.
-
Slide Structure
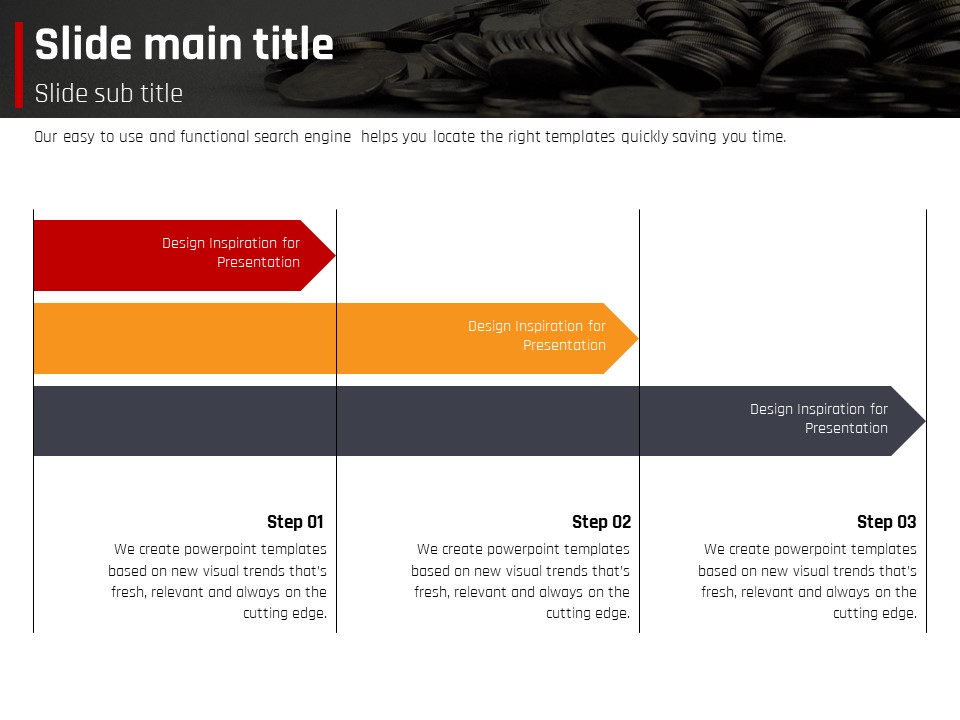
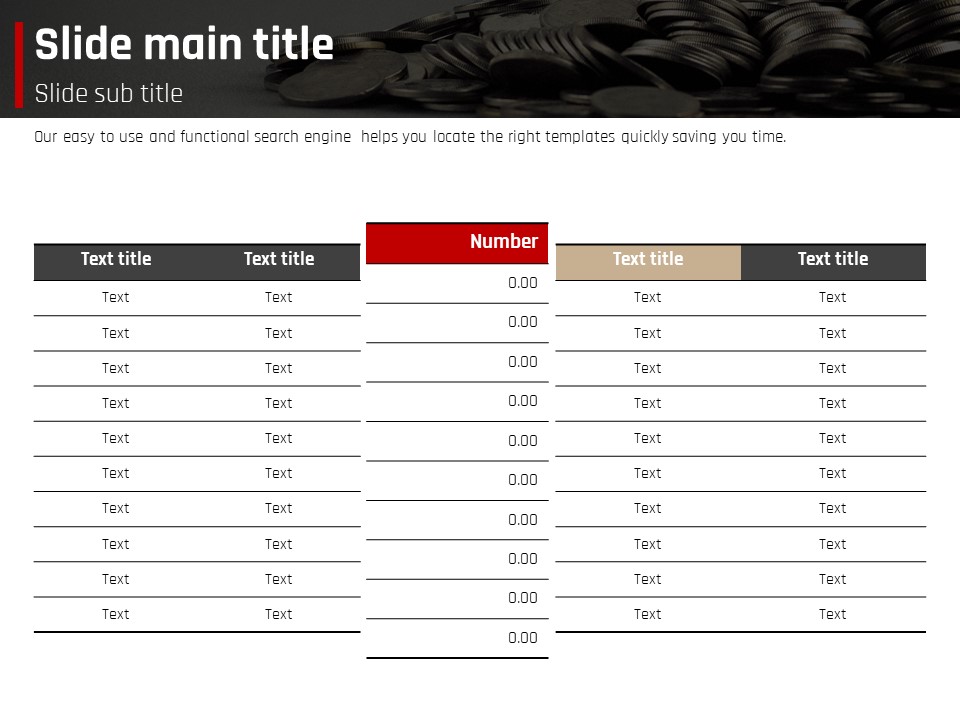
35 slides total: a dramatic coin-and-lightbulb photo cover, a 4-segment circular flow diagram (red, charcoal, orange, gray), a 4-icon parallel content layout, and a 3-panel pie chart comparison slide (red and charcoal two-tone) for financial ratio visualization.
Related Products
-

Entertainment Company Presentation Template – Stylish and Colorful Design
#Business
-

Fountain Pen Theme Presentation – Elegant Business Slide Design
#Business
-

Finance Presentation Template – Sleek and Modern Design
#Business
-

Multitasking Presentation Template – Optimized Design for Business
#Business
