Donut Chart for Asset Allocation Breakdown – Market Share Analysis
RB0100053_5
- Last Update 03/06/2025
- File Size 2.5MB
- # of Slides 2
- File Format PPTX
- Slide Ratio 4:3
- Color
Keywords
- #Content-Based Slides
- #Design-Based Slides
- #Product/Service Introduction
- #Market and Competitor Analysis
- #Graph
- #Development Status
- #Market Share
- #Circles
- #Doughnut Chart
- #4:3
- #donut chart PowerPoint
- #pie chart slide template
- #asset allocation breakdown
- #market share donut
- #data visualization presentation
- #ratio analysis chart
About the Product
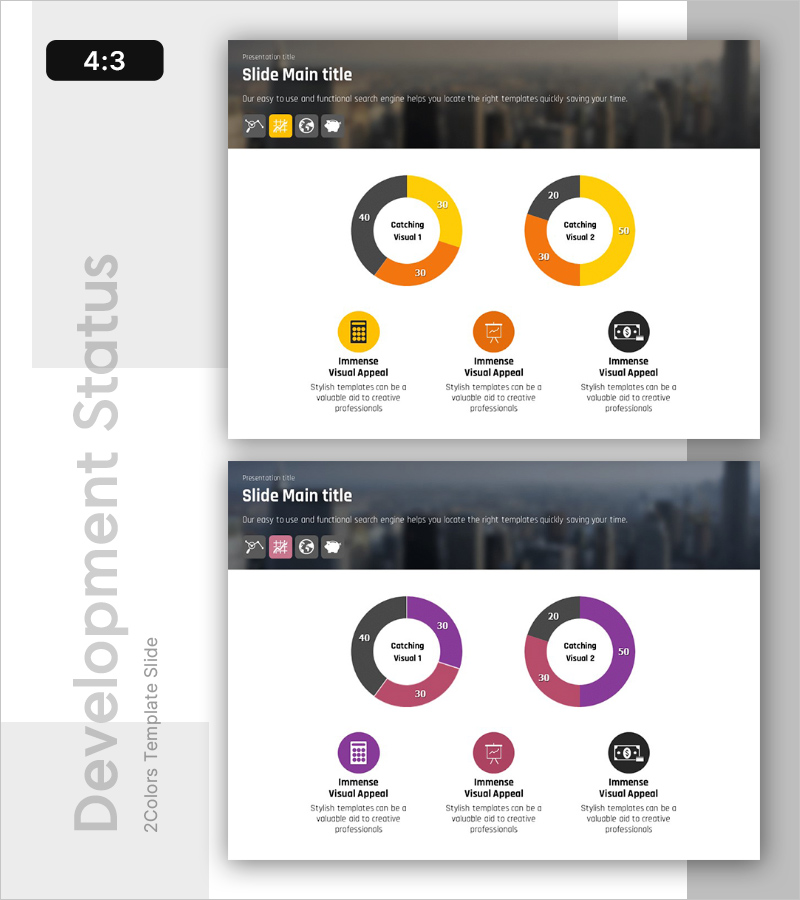
A 2-slide PowerPoint presentation featuring donut charts designed to visualize asset allocation ratios and market share distribution. Each slide displays a three-segment donut chart with a central label area for key metrics or titles. The first slide uses a charcoal, yellow, and orange color palette, while the second employs purple, pink, and gray tones, providing flexibility for different presentation contexts. Numerical labels and clear data segments enable immediate use in financial analysis, portfolio composition, and market share presentations. Delivered in 4:3 aspect ratio PPTX format with fully editable elements.
Usage Points
-
Main Usage
Effectively communicates part-to-whole relationships for financial asset composition, portfolio allocation, market share distribution, revenue breakdown, and customer segmentation. The central space accommodates key metrics or titles, enhancing visual emphasis and data clarity.
-
How to Use
Ideal for investor presentations, financial reports, marketing analysis briefings, and business plan pitches where composition ratios require clear visualization. Simply replace the default data labels and percentages with your own figures. Select the color palette that best matches your presentation theme and organizational branding.
-
Recommended For
Finance teams, investor relations departments, marketing teams, and executive presentations. Particularly valuable for asset management firms, financial institutions, consulting companies, startup investor pitches, and corporate divisional performance reports.
-
Slide Structure
2-slide set. Each slide features a donut chart with 3 equal segments, central text area for labels, and numerical indicators. Slide 1: charcoal (40%), yellow (30%), orange (30%). Slide 2: gray (40%), purple (30%), pink (30%). All segments include percentage labels and are fully customizable.
Related Products
-

Analysis graph of market share progress
#Product/Service Introduction #Market and Competitor Analysis #Graph
-

City Theme Market Share Graph – Business Data Visualization
#Product/Service Introduction #Market and Competitor Analysis #Graph
-

Analysis of Transportation Usage Status – Pie Chart
#Product/Service Introduction #Market and Competitor Analysis #Graph
-

Financial Business Analysis Pie Chart – Market Share Insights
#Product/Service Introduction #Market and Competitor Analysis #Graph
