Asset Management Presentation Template – Dynamic and Modern Design
B0100053
- Last Update 01/01/2025
- File Size 15.1MB
- # of Slides 20
- File Format PPTX
- Slide Ratio 4:3
- Color
Slide Preview

Keywords
About the Product
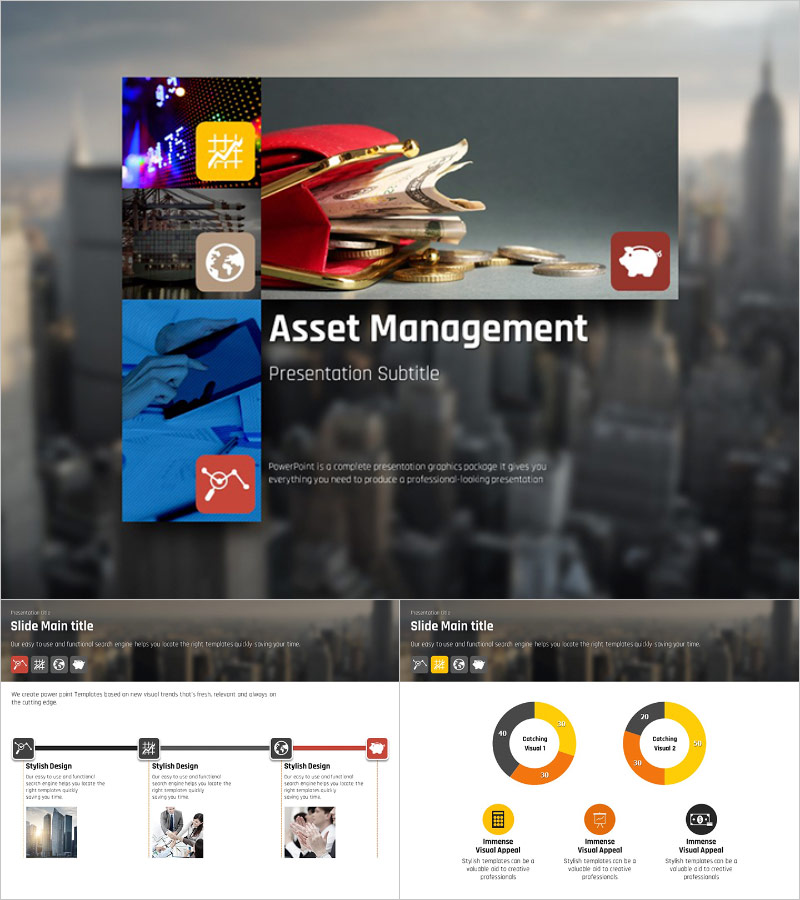
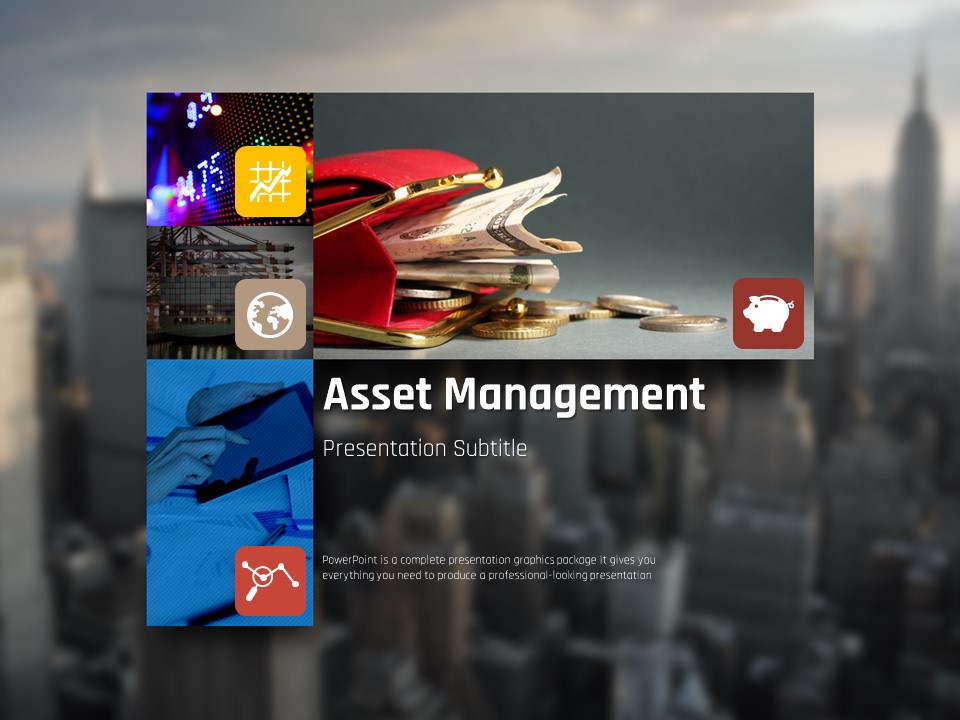
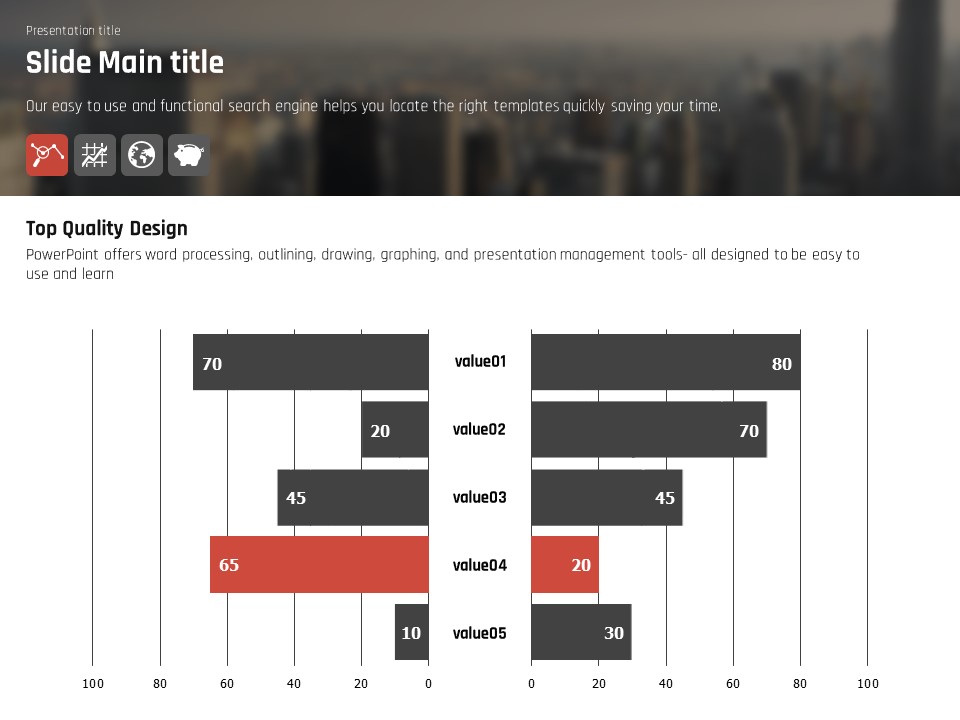
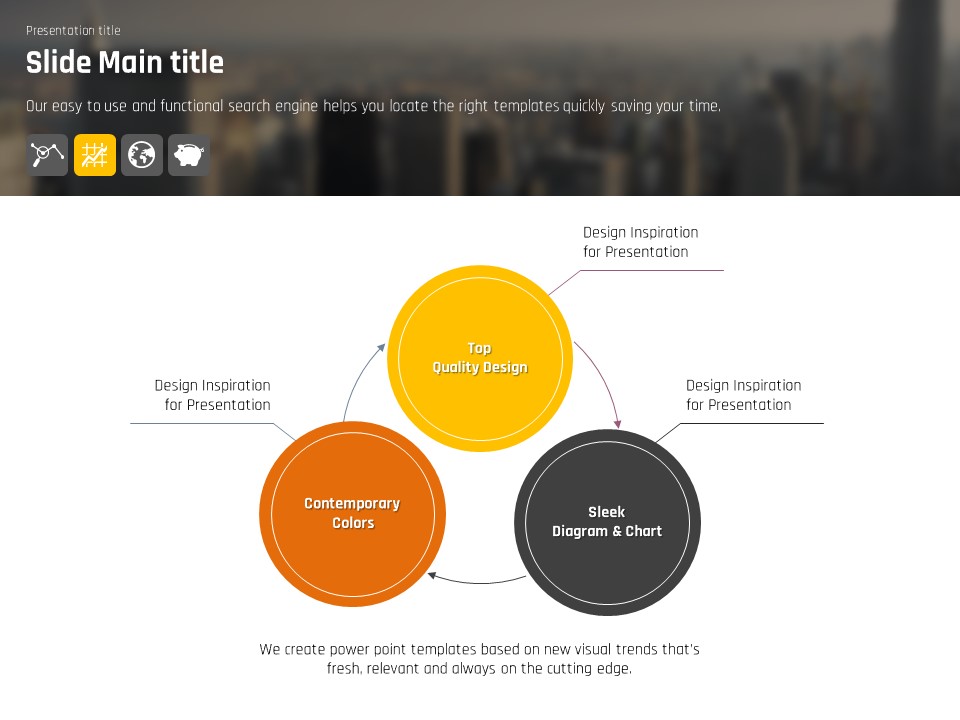
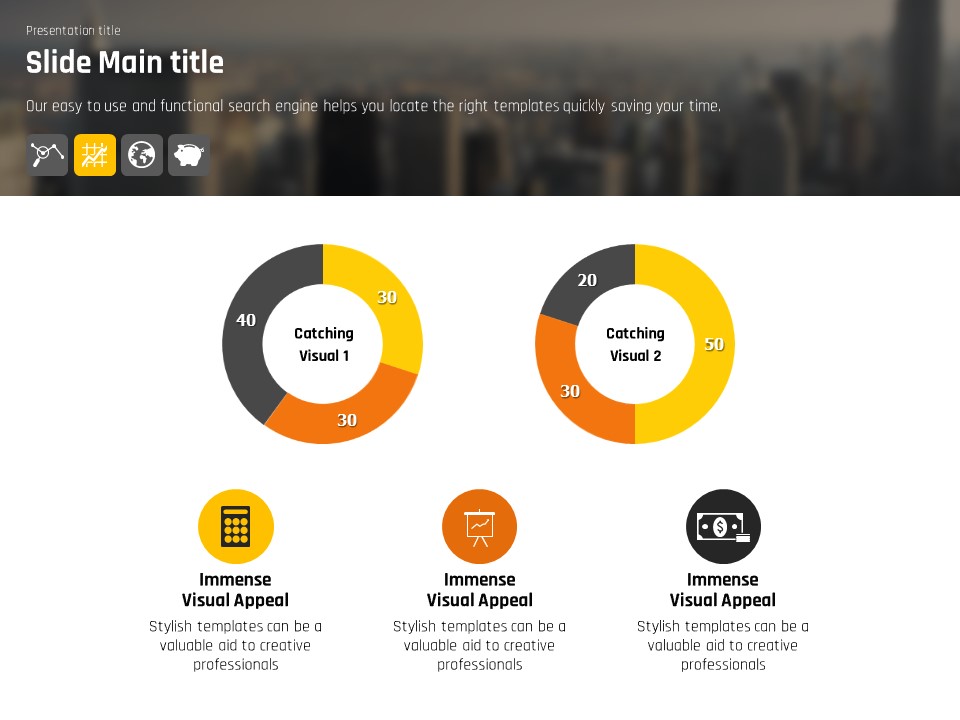
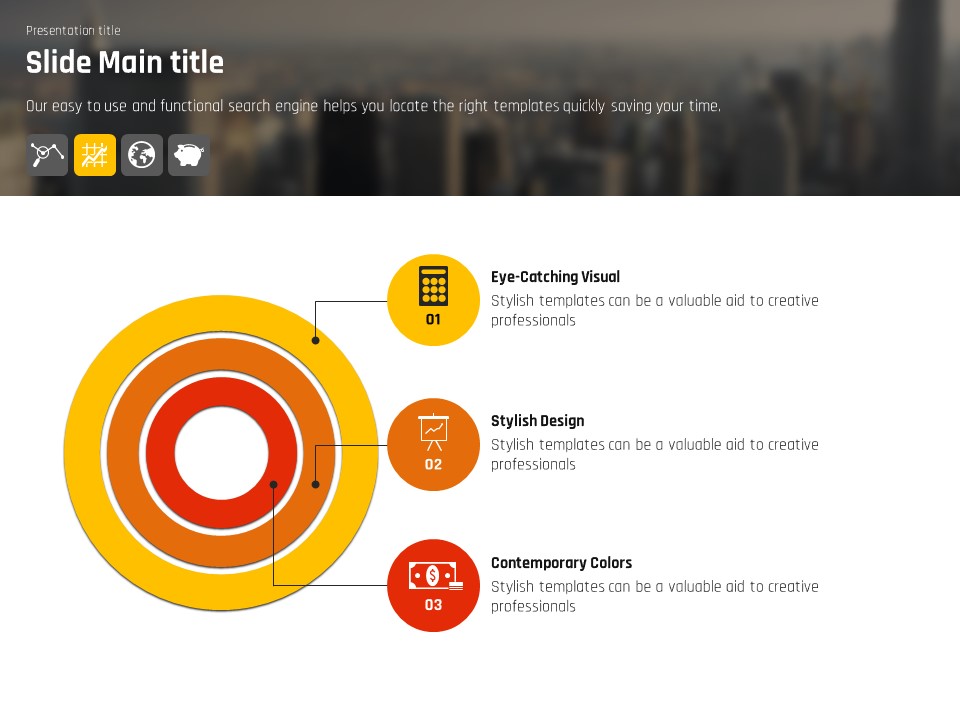
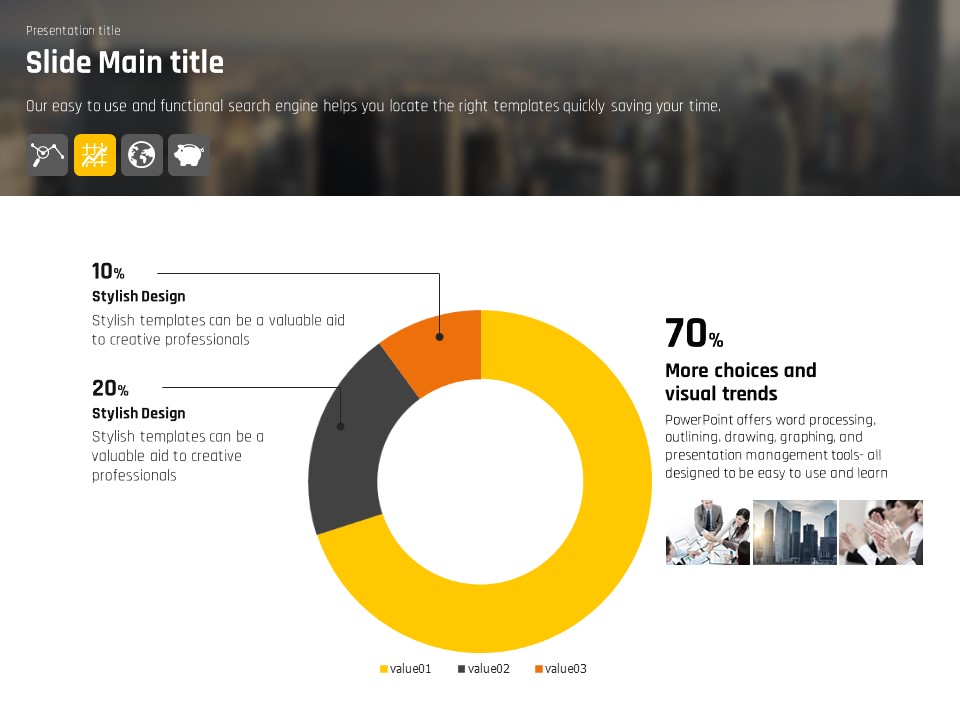
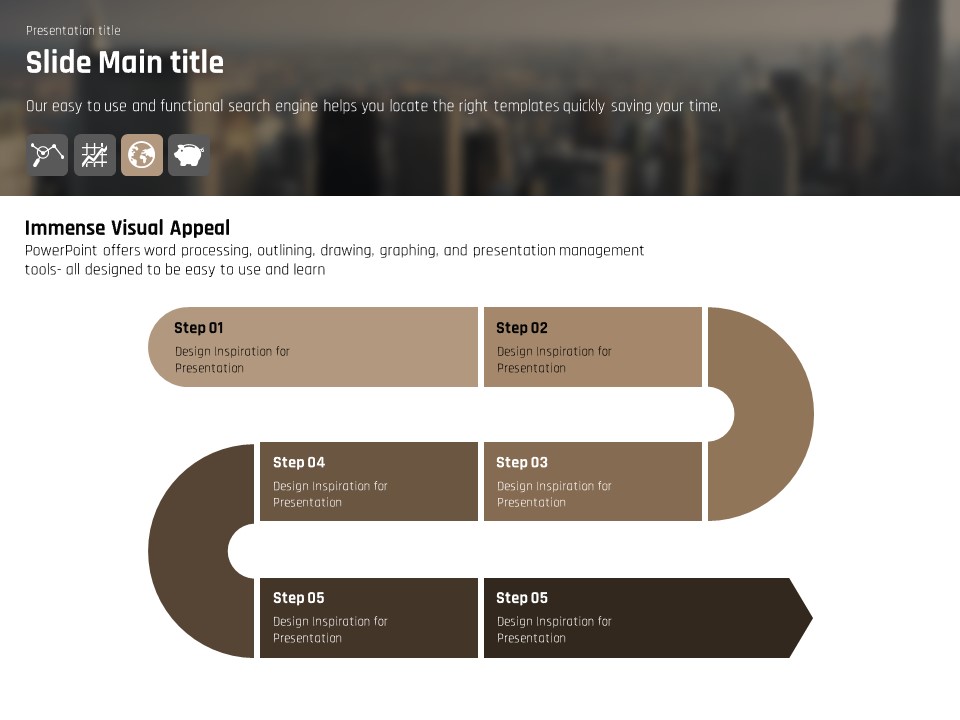
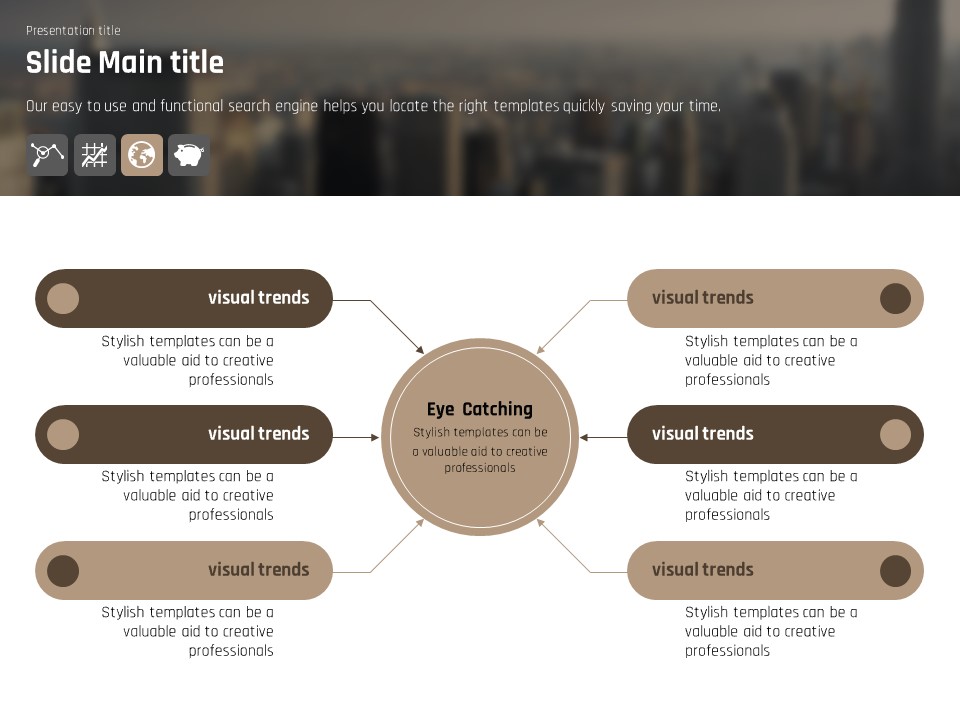
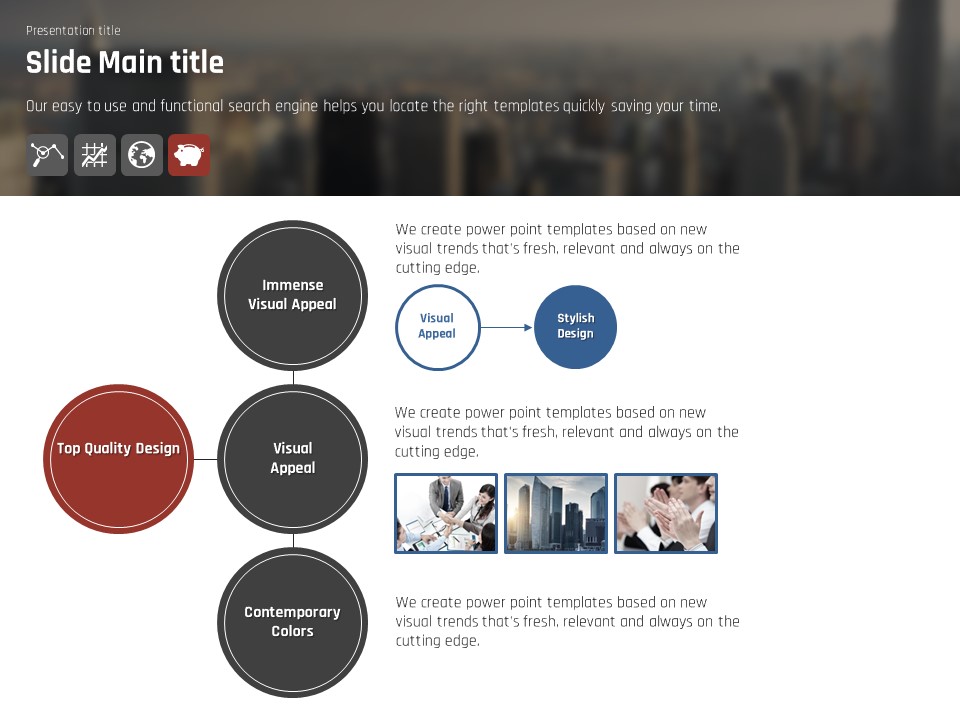
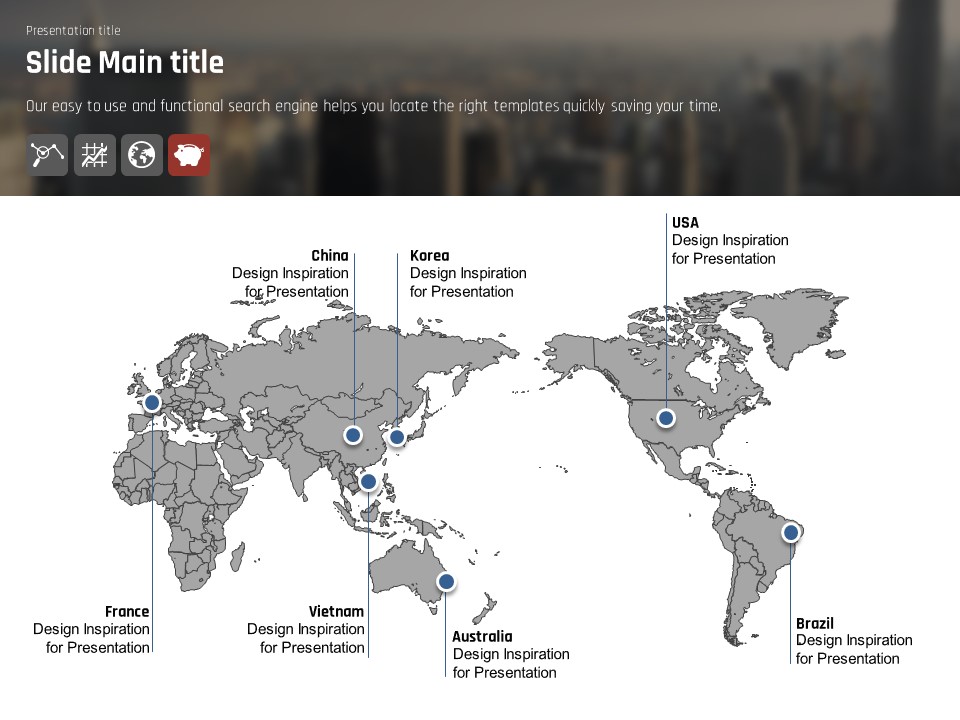
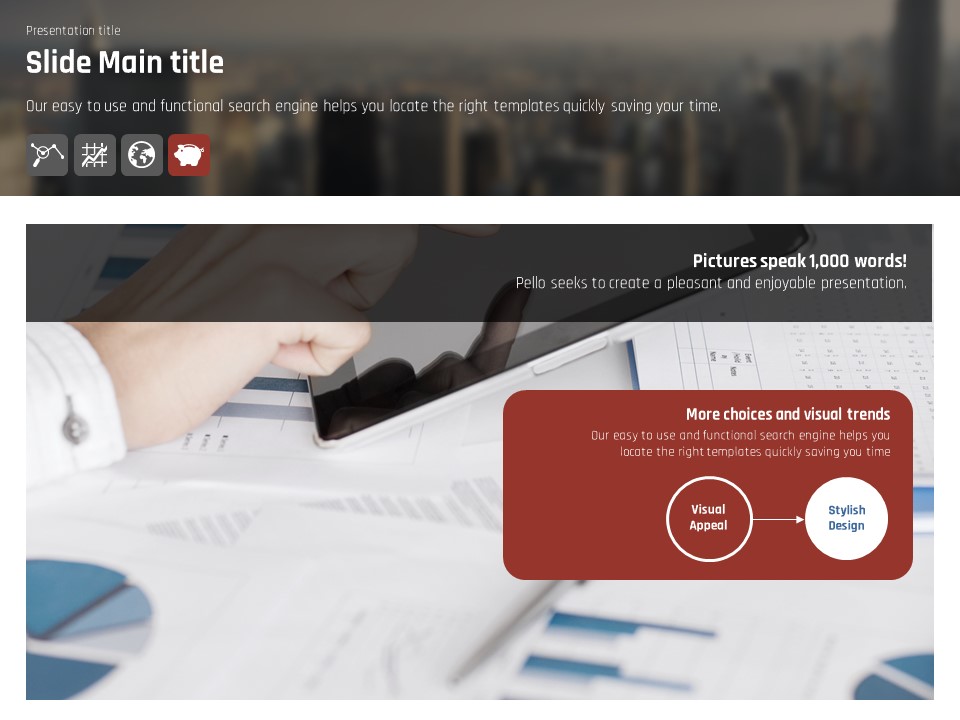
A PowerPoint template built for finance and asset management presentations, featuring a dark charcoal background paired with high-contrast yellow, orange, and red accent colors. The cover slide combines real-photo collages of wallets, coins, and city skylines with finance-themed icons including a piggy bank, globe, and stock chart. Inner slides deliver data-rich layouts: dual donut charts for portfolio breakdowns, concentric circle diagrams for strategy visualization, and three-column icon grids for key metrics. The full 20-slide PPTX deck is immediately editable—swap in your own figures, replace placeholder text, and update chart values without any design expertise. Formatted in 4:3 ratio for compatibility with standard monitors and projectors. Ideal for investment briefings, portfolio reviews, wealth management pitches, and financial strategy presentations across banking, fintech, and asset management sectors.
Usage Points
-
Main Usage
Designed for finance professionals presenting investment portfolios, asset allocation strategies, and fund performance reports to clients, investors, or internal stakeholders in banking and wealth management contexts.
-
How to Use
Download the PPTX file and open it directly in PowerPoint. Replace the placeholder text, update the donut chart percentages with your actual portfolio data, and swap the concentric diagram steps to reflect your strategy—ready to present in minutes.
-
Recommended For
Financial analysts, asset managers, investment consultants, fintech startup teams, and bank or securities firm presenters who need to communicate complex financial data clearly and with visual impact.
-
Slide Structure
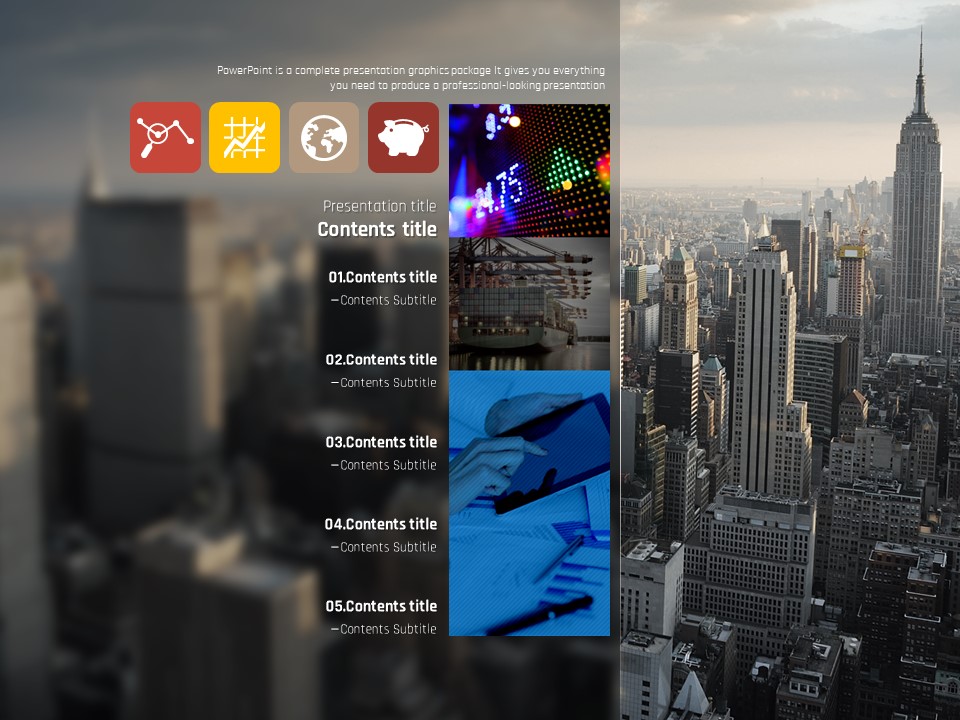
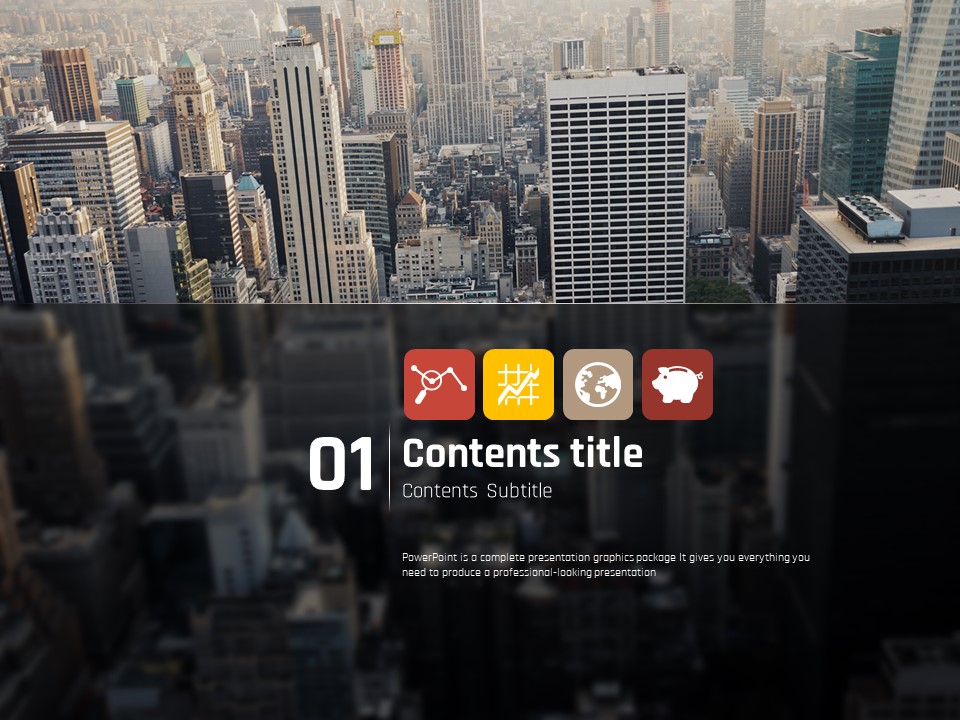
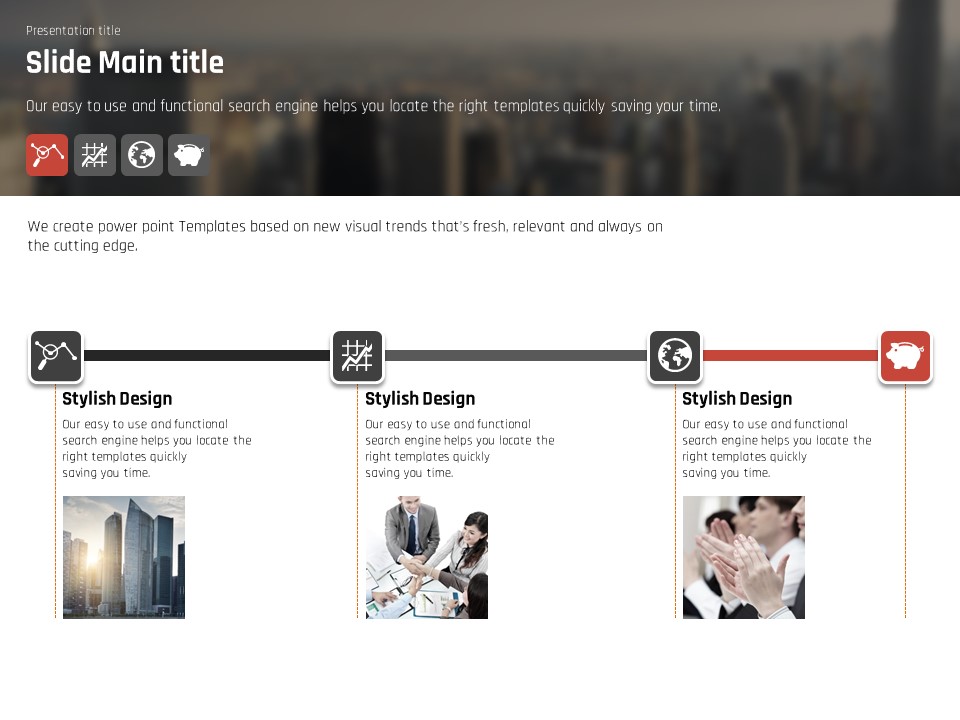
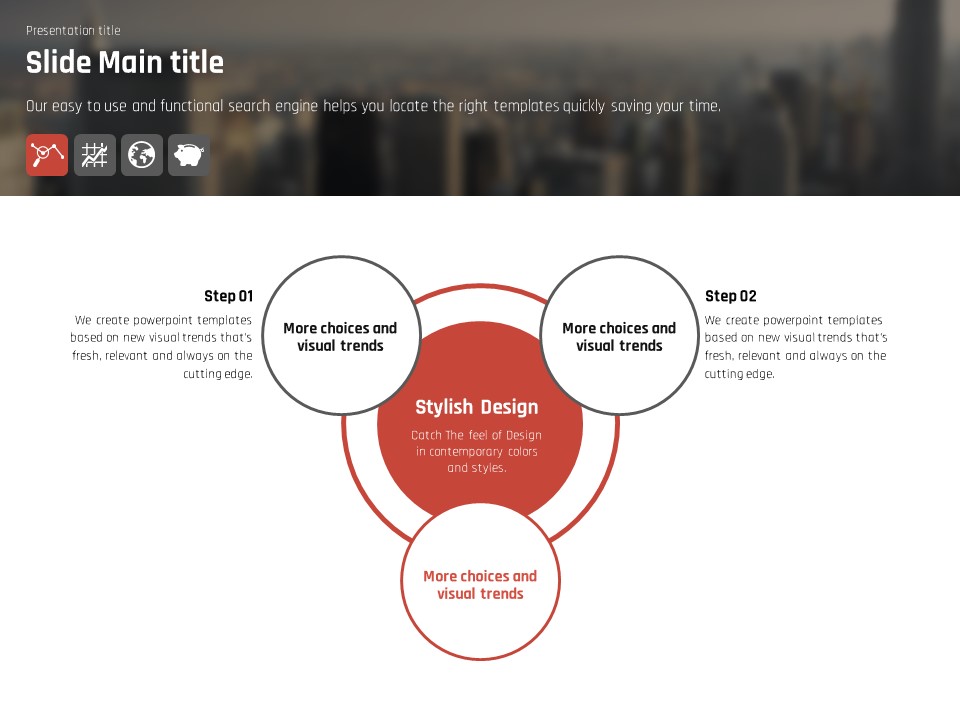
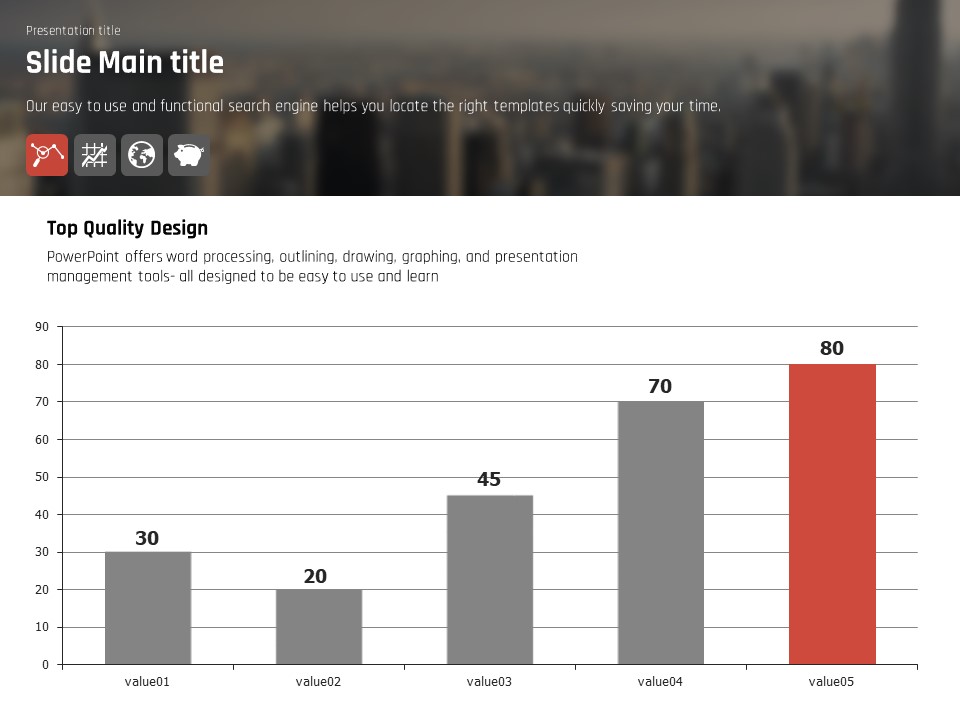
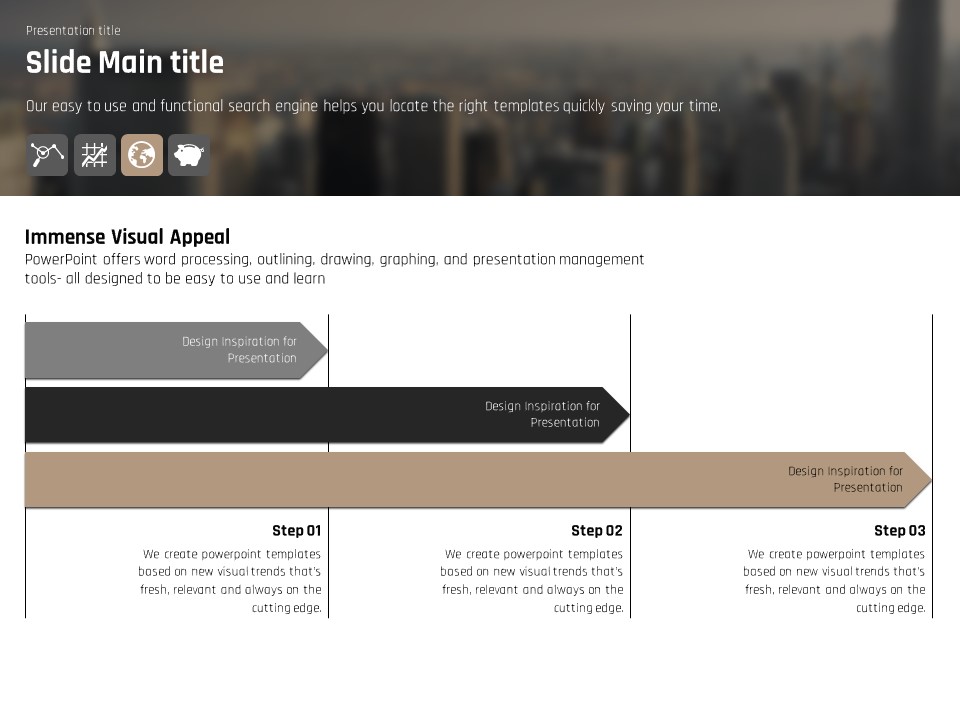
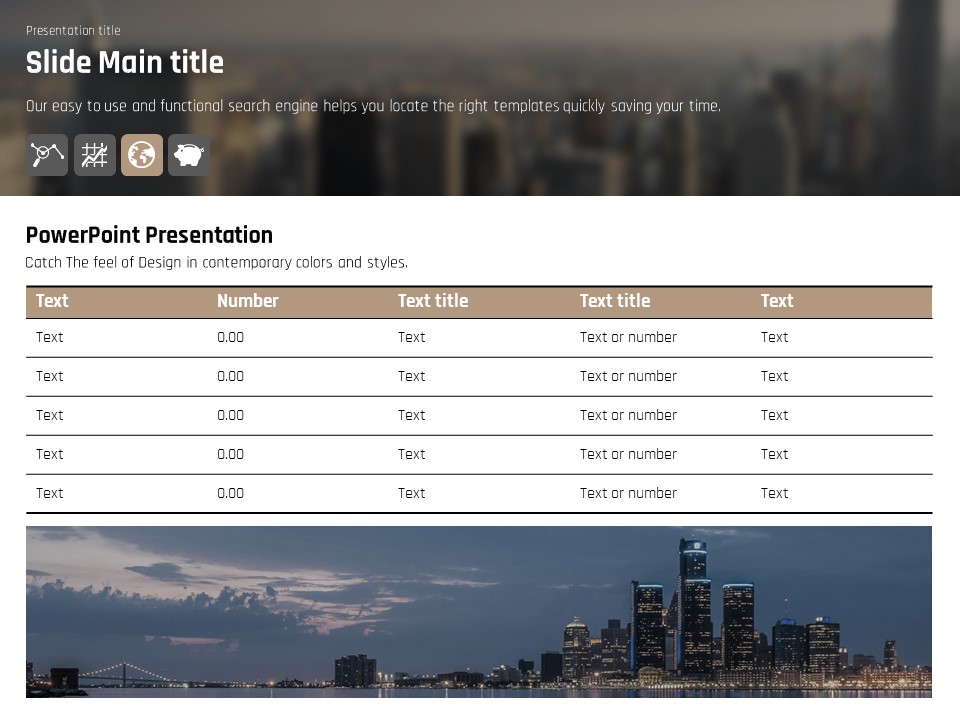
20 slides total: cover slide with photo collage and title, data visualization slides featuring dual donut charts and three-column icon grids, strategy slides with concentric circle diagrams and numbered three-step lists, all sharing a consistent dark-themed icon navigation header.
Related Products
-

Business Partnership PowerPoint Template – Build Trust with Elegant Design
#Business
-

Partnership PowerPoint Template – Ideal for Business Presentations
#Business
-

Multitasking Presentation Template – Optimized Design for Business
#Business
-

Illustrated Folder Presentation Template – Stylish and Practical Design
#Business
