Global Network Market Trends – Insights through Data Visualization
RM0700009_4
- Last Update 02/27/2025
- File Size 20.2MB
- # of Slides 4
- File Format PPTX
- Slide Ratio 16:9
- Color
Keywords
- #Content-Based Slides
- #Design-Based Slides
- #Company Introduction
- #Market and Competitor Analysis
- #Graph
- #Other
- #Global Network
- #Market Analysis
- #Circles
- #Doughnut Chart
- #Map
- #16:9
- #world map PowerPoint slide
- #global network presentation
- #regional data visualization
- #pie chart template
- #market trend slide download
About the Product
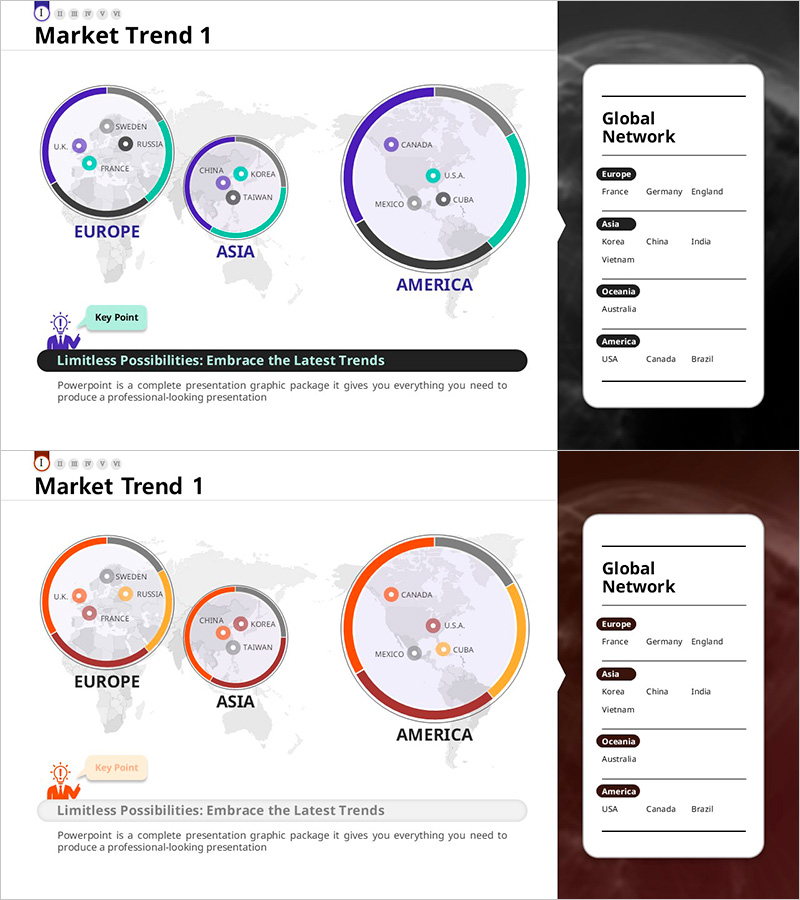
A 4-slide PowerPoint presentation set for visualizing global market trends and regional data distribution. Features three regional pie charts (Europe, Asia, America) overlaid on a world map background, enabling side-by-side comparison of key countries including USA, Canada, China, India, and Australia. Combines pie and donut chart formats to represent data across multiple dimensions, with country labels and network indicators for each region. Delivered in 16:9 widescreen PPTX format, fully editable and ready for immediate use in market analysis presentations, executive reports, investor pitches, and international business communications.
Usage Points
-
Main Usage
Visualize global market conditions, regional data comparisons, and international network structures in a single integrated layout. The world map background combined with overlaid pie charts enables simultaneous communication of geographic location and quantitative metrics. Ideal for presenting global strategy, market share by region, and regional performance to executives, investors, and international stakeholders.
-
How to Use
Replace pie chart data values with your own statistics for each region (Europe, Asia, America). Update country names and numerical figures to reflect current data. Customize color schemes (blue, orange, green) to match corporate branding guidelines. Add text boxes and icons to highlight key insights, and adjust background elements to maintain visual consistency with other presentation slides.
-
Recommended For
Executives, marketing teams, sales departments, and strategic planning units presenting global market analysis, regional performance reports, and international expansion strategies. Suitable for investor presentations, industry conferences, C-suite briefings, and client proposals emphasizing international scale and geographic diversification. Particularly effective for multinational corporations, import-export businesses, and global service providers demonstrating market presence.
-
Slide Structure
4-slide layout: ① Title slide (Market Trend 1 header) ② Europe and Asia regional pie charts with world map background ③ Large America regional pie chart with emphasized world map ④ Global Network directory listing countries by region (Europe, Asia, Oceania, America). Each pie chart contains 3–5 data segments with color-coded series (blue, orange, green, gray) for clear data differentiation.
Related Products
-

Global Market Analysis Chart – Market Trends and Data Visualization
#Company Introduction #Market and Competitor Analysis #Graph
-

Forest Illustration Global Map – Visualizing Market Analysis
#Company Introduction #Market and Competitor Analysis #Other
-

Idea Presentation Template Wide Map – Global Market Analysis
#Company Introduction #Market and Competitor Analysis #Other
-

Global Market Snapshot – Market Analysis and Outlook
#Company Introduction #Market and Competitor Analysis #Diagram
