Natural Vertical Bar Segment Chart – A Key Tool for Market Analysis
RJ0600087_17
- Last Update 07/14/2025
- File Size 3.5MB
- # of Slides 2
- File Format PPTX
- Slide Ratio 16:9
- Color
Keywords
- #Content-Based Slides
- #Design-Based Slides
- #Business Strategy
- #Market and Competitor Analysis
- #Graph
- #Achievements
- #Industry Trends
- #Column
- #Segmented Column
- #16:9
- #vertical stacked bar chart
- #segmented bar graph PowerPoint
- #4-category data comparison
- #market analysis slide template
- #hierarchical data visualization
- #stacked column chart download
About the Product
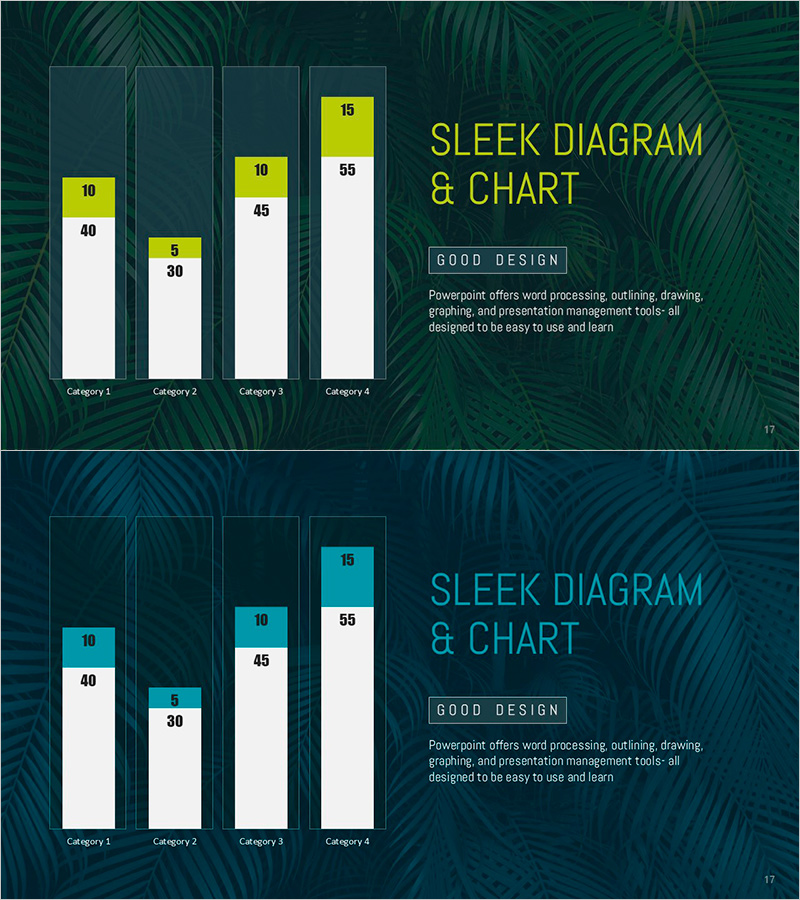
A vertical stacked bar chart PowerPoint slide optimized for market analysis and comparative performance reporting. Each of the four categories displays two-tier data segmentation with yellow highlights for primary values and white sections for secondary values, enabling clear visualization of hierarchical data structures. The 2-slide deck features dual color schemes (yellow and teal accents) against a natural palm-leaf background, making it ideal for business presentations, sales reports, and strategic analysis. Fully editable in 16:9 widescreen format, this PowerPoint slide template supports complex data comparison at a glance.
Usage Points
-
Main Usage
Ideal for presenting hierarchical data across multiple categories, such as market share by region and product line, departmental performance with sub-metrics, or customer segmentation analysis. The two-tier stacking structure allows simultaneous comparison of primary and secondary data points within each category.
-
How to Use
Input primary values (yellow segment) and secondary values (white segment) for each of the four categories. Choose between the yellow or teal accent color scheme to match your presentation theme. All text, numbers, and colors are fully customizable in PowerPoint.
-
Recommended For
Marketing managers, sales directors, financial analysts, business consultants, and data-driven professionals presenting quarterly reports, market analysis, budget breakdowns, or strategic performance metrics. Suitable for board meetings, investor presentations, and internal business reviews.
-
Slide Structure
2-slide template featuring identical 4-category vertical stacked bar chart layouts with alternating color schemes. Slide 1 uses yellow accent colors; Slide 2 uses teal accents. Both include gridlines and natural background design for enhanced readability and professional appearance.
Related Products
-

Real Estate Market Trends Chart – Data Analysis and Performance
#Business Strategy #Market and Competitor Analysis #Graph
-

Red Green Market Analysis Slide – Effective Data Visualization
#Business Strategy #Market and Competitor Analysis #Diagram
-

Farm Subdivision Vertical Bar Graph – Market Trend Analysis
#Market and Competitor Analysis #Graph #Market Status
-

Pork Consumption Stack Chart – Market Trend Analysis
#Market and Competitor Analysis #Graph #Market Analysis
