Time Usage by Work Area – Market Analysis
RB0100048_7
- Last Update 03/06/2025
- File Size 0.7MB
- # of Slides 2
- File Format PPTX
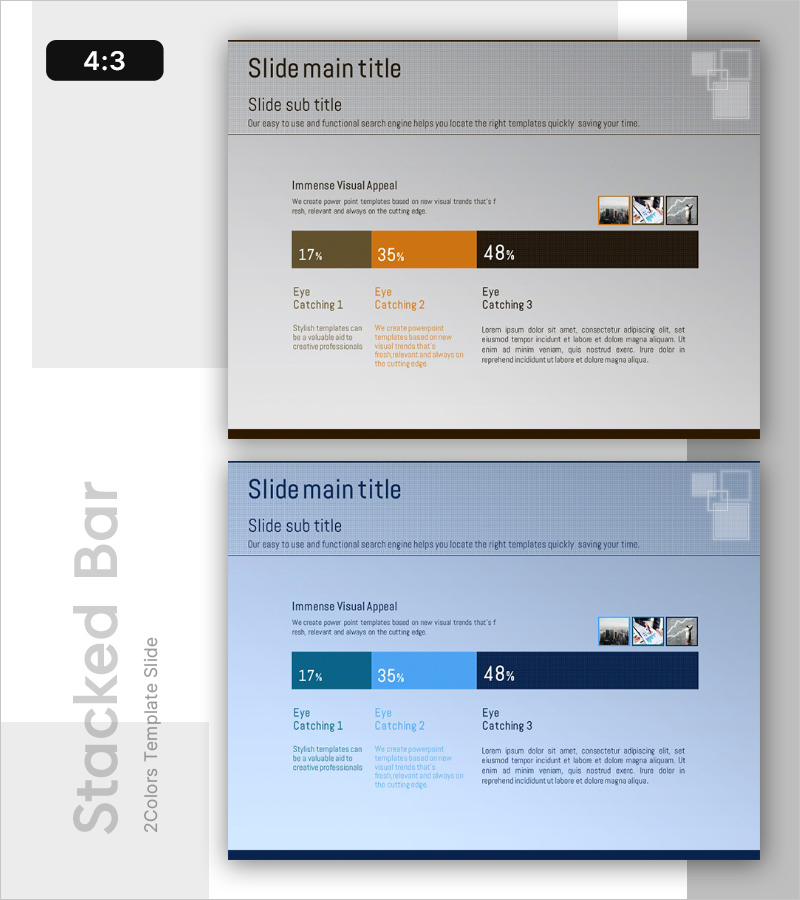
- Slide Ratio 4:3
- Color
Keywords
About the Product
A horizontal bar chart PowerPoint slide that visualizes time usage distribution across work areas. The slide displays three items with percentage values (17%, 35%, 48%) using a three-color scheme of brown, orange, and black. Each item includes a title and descriptive text area below the bar, making it ideal for market analysis, competitive analysis, and work area assessment presentations. The 4:3 aspect ratio with 2-slide format allows easy customization and effectively communicates numerical data at a glance.
Usage Points
-
Main Usage
Visualizes percentage distribution of three work areas or data categories using horizontal bars with numerical values. The three-color scheme (brown, orange, black) clearly differentiates each item, while text areas below provide space for detailed explanations and insights.
-
How to Use
Replace the percentage values with your actual data, update item titles and descriptions to match your content. Use for market share analysis, resource allocation reports, work efficiency assessments, or any three-item comparative data presentation. Additional slides can be added for more than three items.
-
Recommended For
Executives, marketing teams, strategy planners, consultants, and data analysts. Ideal for business plans, market analysis reports, management presentations, strategic planning meetings, and quarterly performance reviews where percentage-based data needs clear visual communication.
-
Slide Structure
2-slide set with title and subtitle areas, three horizontal bars with percentage labels (17%, 35%, 48% as examples), and dedicated title and description text fields for each item. 4:3 aspect ratio with fully editable colors, values, and text content.
Related Products
-

Demand Charts in Region – A Convincing Tool for Market Analysis
#Market and Competitor Analysis #Graph #Other
-

Visualizing Market Share with Plus Donut Chart
#Market and Competitor Analysis #Diagram #Graph
-

Graph Slide Highlighting the Importance of Drinking Water - Market Analysis
#Market and Competitor Analysis #Graph #Other
-

Mint Green Mixed Graph – Market Status Analysis
#Market and Competitor Analysis #Graph #Other
