Regional Outlook Graph – Visualizing Market Status
RJ0900019_25
- Last Update 08/21/2025
- File Size 0.4MB
- # of Slides 2
- File Format PPTX
- Slide Ratio 16:9
- Color
Keywords
- #Content-Based Slides
- #Design-Based Slides
- #Market and Competitor Analysis
- #Graph
- #Other
- #Market Status
- #Market Analysis
- #16:9
- #regional outlook graph PowerPoint
- #market status visualization slide
- #US map data chart
- #regional market analysis PPT
- #how to create a regional comparison slide in PowerPoint
About the Product
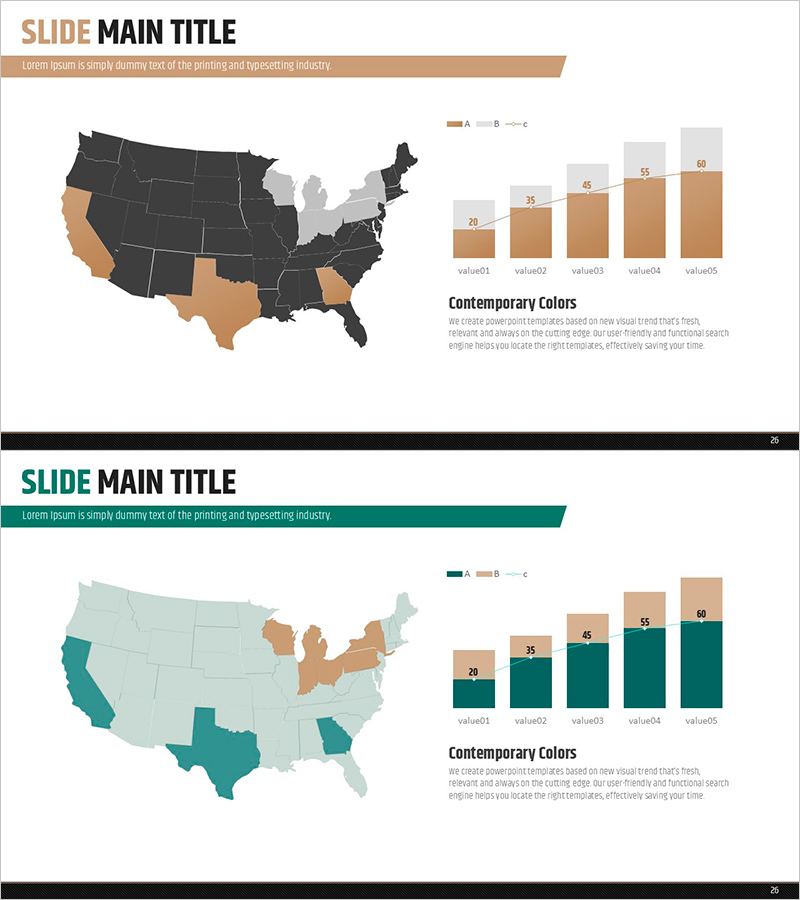
A PowerPoint slide that visualizes market status by region using a US map and comparative bar chart. The left side displays a US map with state-level data color-coded, while the right side shows a 5-step bar graph for numerical comparison. The beige, dark gray, and light gray color palette creates a professional appearance suitable for business presentations. With 2 slides, you can represent regional market conditions, competitor distribution, and target market analysis. Clear text input areas and legend make this ready-to-use presentation material for market analysis reports.
Usage Points
-
Main Usage
Displays regional market data simultaneously through map visualization and numerical graphs, enabling stakeholders to understand market conditions at a glance. Ideal for presentations combining geographic information with quantitative data such as competitor distribution, regional market share, and target market analysis.
-
How to Use
Color-code each state on the US map to represent regional data, and input specific values in the bar graph on the right. Add analysis topics in the title and legend areas to use for market analysis, sales performance reports, and customer distribution presentations.
-
Recommended For
Serves as the market analysis section in marketing plans, business proposals, and investor pitch decks. Supports regional-based decision-making in sales team performance reports, executive strategy meetings, and client proposal presentations.
-
Slide Structure
Both slides 1 and 2 share the same layout. The structure includes a title area at the top, a US map with 5-6 color-coded states on the left, a 5-step bar graph with legend on the right, and descriptive text area at the bottom.
Related Products
-

Market Analysis Graph for Mobile Networks
#Market and Competitor Analysis #Graph #Other
-

Triangular Pattern Presentation Template Area Chart – Market Analysis and Competitive Edge
#Market and Competitor Analysis #Graph #Other
-

Mint Green Mixed Graph – Market Status Analysis
#Market and Competitor Analysis #Graph #Other
-

Simple Mixed Rounded Vertical Bar Graph – Intuitive Representation of Market Status
#Market and Competitor Analysis #Graph #Other
