Visualizing Market Trends with Tree Object Area Chart – Situational Insights
RJ0600099_27
- Last Update 07/18/2025
- File Size 13.6MB
- # of Slides 2
- File Format PPTX
- Slide Ratio 16:9
- Color
Keywords
About the Product
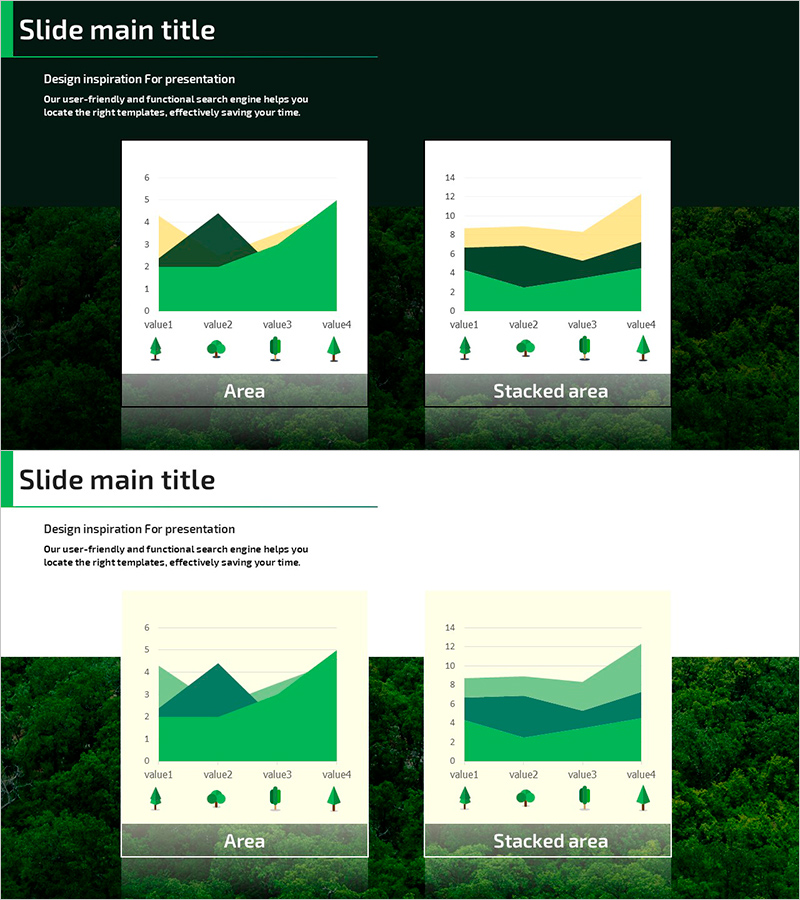
A tree object area chart PowerPoint slide designed to visualize market trends and competitive analysis with intuitive data representation. The 2-slide set features dark green, lime green, and yellow layered color schemes optimized for area-based data comparison. Each slide displays four categorical values with tree icons emphasizing environmental and sustainability themes. Provided in 16:9 widescreen format with fully editable numbers, legends, and labels for immediate presentation use.
Usage Points
-
Main Usage
Compares multiple datasets such as market conditions, competitive positioning, and business performance using area-based visualization. Tree icons implicitly convey environmental, sustainability, and growth themes while simultaneously displaying four categorical values to support decision-making.
-
How to Use
Apply in market analysis sections of business plans, investor pitch decks, and marketing strategy presentations to express competitive landscape, market share, and growth trends. Area heights and colors distinguish numerical magnitude and categories, making it ideal for presenters to point and explain each segment.
-
Recommended For
Recommended for strategy planning teams, marketing departments, and executive presentations. Particularly valuable for B2B presentations requiring market analysis, competitive comparison, business performance analysis, investor relations, and executive briefing materials.
-
Slide Structure
Two-slide composition: ① Area chart (simple stacked area) ② Stacked area chart (layered accumulation). Each slide features three-section layout with title area, chart area, and legend area, with four value categories and editable numerical input fields.
Related Products
-

Bar Chart Visualizing Yacht Tour Satisfaction
#Market and Competitor Analysis #Graph #Other
-

Area Chart for Science Topics – Gain Competitive Advantage through Data Analysis
#Market and Competitor Analysis #Graph #Other
-

Backpacking Traveler Trends Analysis Graph – Future of Travel Industry
#Technical Approach #Market and Competitor Analysis #Graph
-

Market Analysis Donut Slide for Restaurant Tour Countries
#Market and Competitor Analysis #Graph #Other
