Effects of Combined Use of Cosmetics – Market and Benefit Analysis
RJ0800008_18
- Last Update 08/01/2025
- File Size 2.3MB
- # of Slides 2
- File Format PPTX
- Slide Ratio 16:9
- Color
Keywords
- #Content-Based Slides
- #Design-Based Slides
- #Product/Service Introduction
- #Market and Competitor Analysis
- #Diagram
- #Graph
- #Other
- #Benefits and Advantages
- #Future Outlook
- #Cluster
- #Chain Diagram
- #16:9
- #area chart PowerPoint
- #trend comparison slides
- #market analysis graph
- #data visualization PPT
- #area graph template download
About the Product
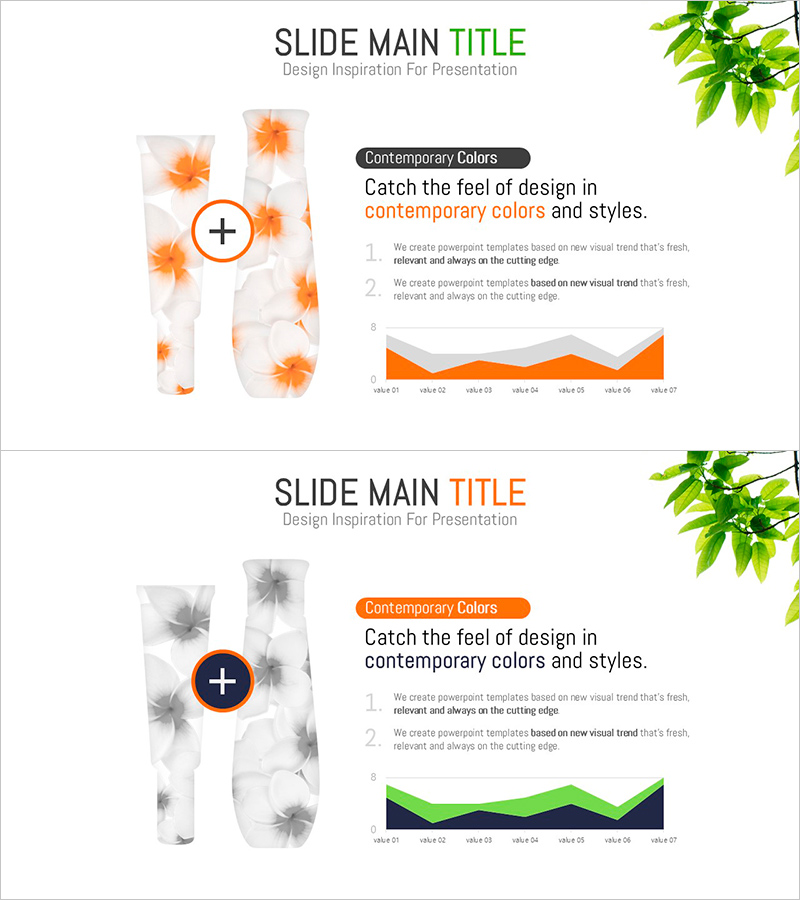
A 2-slide area chart PowerPoint presentation template for visualizing cosmetics market analysis and combined-use effects. The dual-tone orange and green area graphs intuitively display numerical changes and comparative trends over time. Instantly applicable to healthcare and beauty industry presentations, marketing strategy documents, and market analysis reports where data-driven insights need emphasis. Compatible with all presentation environments in 16:9 widescreen PPTX format.
Usage Points
-
Main Usage
Communicate market size and effect changes in cosmetics combined use through time-axis-based area graphs, delivering data-driven marketing insights. The overlapping two-series area structure clearly visualizes comparative relationships, enabling healthcare and beauty industry presentations to emphasize credible numerical analysis.
-
How to Use
Place in market analysis sections or product comparison pages to substantiate synergy effects from combined use with quantitative data. Map orange area to single-use and green area to combined-use data, or apply as time-period market growth rates. Highlighting each segment during presentation increases audience engagement and data retention.
-
Recommended For
Cosmetics and beauty brand marketing managers, healthcare industry analysts, market research report writers, product development teams presenting efficacy validation, and executive presentations emphasizing data credibility in investment pitch materials.
-
Slide Structure
Two-slide composition with independent area graphs on each slide. First slide features single orange-tone area; second slide displays overlapping orange-green dual-tone areas for maximum comparative impact. Seven X-axis segments (value-01 through value-07), Y-axis numerical scale, and legend notation ensure data readability, with text boxes and labels available for key metric annotations.
Related Products
-

Orange Hexagon Template – Segmented Horizontal Bar Graph
#Business Strategy #Market and Competitor Analysis #Graph
-

Blue Green Highlighter Area Chart – A Tool for Market Analysis and Strategy Development
#Market and Competitor Analysis #Marketing Plan and Strategy #Graph
-

Current Status of Financial Services System Slide – Data and Insights
#Product/Service Introduction #Business Vision and Strategy #Diagram
-

Proportional Graph by Meat Part – Market Analysis Insights
#Market and Competitor Analysis #Diagram #Graph
