Causes of Stress for Office Workers – Visualized Donut Chart
RB0100048_5
- Last Update 03/06/2025
- File Size 0.7MB
- # of Slides 2
- File Format PPTX
- Slide Ratio 4:3
- Color
Keywords
About the Product
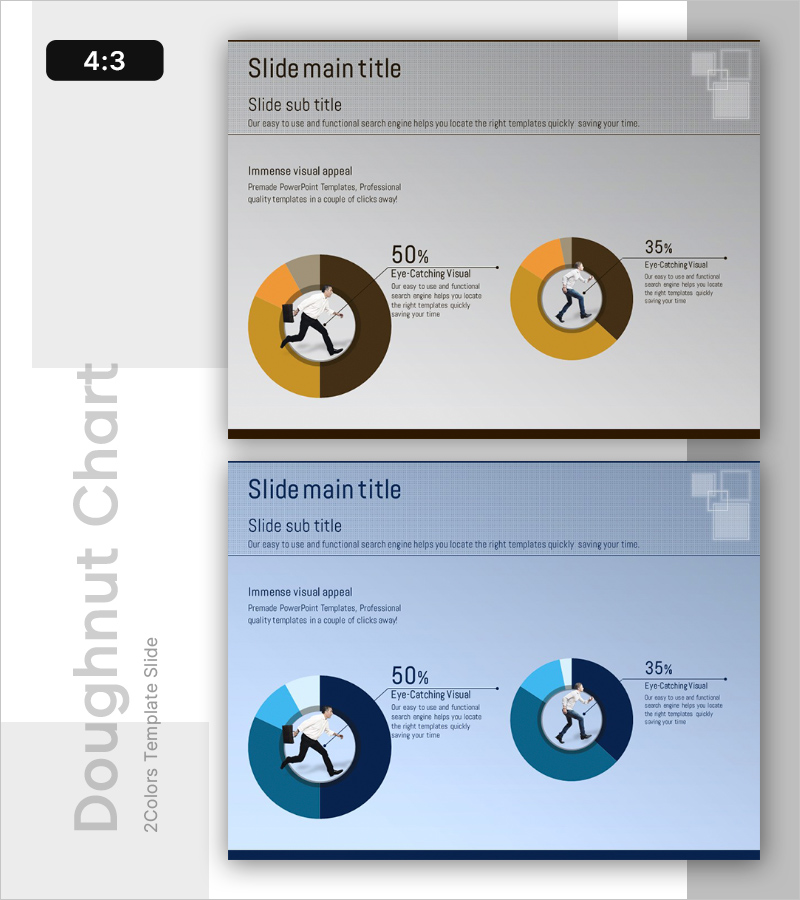
A PowerPoint slide deck visualizing the causes of workplace stress for office workers using donut chart design. The presentation includes two slides with distinct color schemes: the first features warm brown and orange tones, while the second uses navy and sky blue tones. Each slide displays two donut charts with silhouette icons in the center, allowing for intuitive data representation. Percentage values and descriptive text are connected via arrows for immediate presentation use. Provided in 4:3 aspect ratio PPTX format, enabling customization of color combinations to suit various presentation contexts and corporate branding requirements.
Usage Points
-
Main Usage
Quantitatively analyze and present employee stress factors to management and HR teams through data visualization. The centered icon in the donut chart clarifies the topic, while percentage values intuitively convey the proportion of each contributing factor.
-
How to Use
Apply to organizational culture improvement presentations, employee satisfaction survey results sharing, HR policy development meetings, and executive reporting. Replace text and values with your own data, and adjust color schemes to match corporate branding guidelines.
-
Recommended For
HR professionals, organizational development teams, executives, management consultants, and organizational psychology instructors can utilize this for employee analysis, organizational diagnostics, and policy development presentations. Ideal for stress management program proposals and current situation analysis materials.
-
Slide Structure
Two-slide composition featuring dual donut charts per slide (displaying 50% and 35% proportions) with centered silhouette icons. Percentage values and descriptive text are positioned externally and connected via directional arrows. First slide uses warm brown and orange palette; second slide employs navy and sky blue tones for color contrast.
Related Products
-

Children's Competency Analysis Chart – Competitive Market Analysis
#Market and Competitor Analysis #Graph #Customer Analysis
-

Donut Chart Slide Visualizing Marriage Survey Data
#Market and Competitor Analysis #Graph #Customer Analysis
-

Customer Analysis and Market Share Graph – Harmony of Blue and Red
#Market and Competitor Analysis #Graph #Other
-

User Gender Ratio Analysis Graph – Visualizing Market Share
#Market and Competitor Analysis #Graph #Customer Analysis
