Connecting Milestones with Diagrams – Capturing Opportunities in a Fast-Paced Career
RB0100048_4
- Last Update 03/06/2025
- File Size 0.7MB
- # of Slides 2
- File Format PPTX
- Slide Ratio 4:3
- Color
Keywords
About the Product
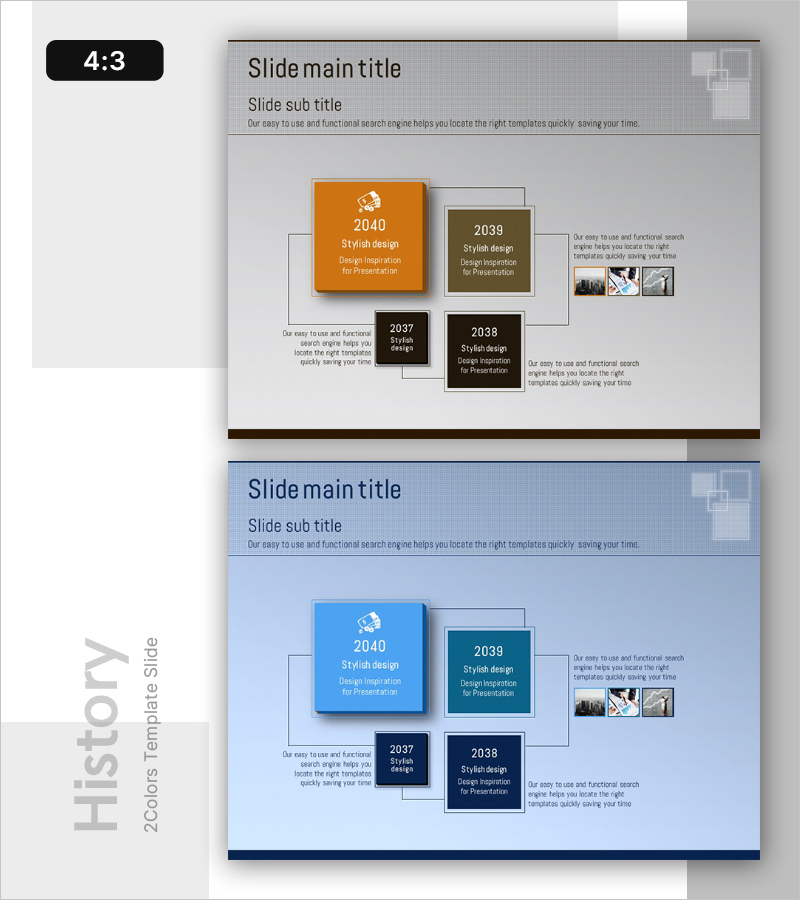
A cluster diagram PowerPoint slide that visualizes company milestones and achievements across four connected nodes arranged in chronological sequence. The design uses three distinct color blocks—orange, olive, and black—to differentiate each milestone period, with a central connecting line emphasizing the progression of organizational growth. The 2-slide set includes both neutral gray and blue background variants, making it ideal for company history presentations, project timelines, and investment pitch decks. Each node features dedicated text and image areas for easy customization, and the 4:3 aspect ratio ensures compatibility across all presentation platforms.
Usage Points
-
Main Usage
Clearly communicate organizational growth, project milestones, and company achievements through a visually connected timeline. Each node can display a year, milestone title, and supporting description, making it ideal for company introductions, annual reports, investor presentations, and organizational history documentation.
-
How to Use
Enter year and milestone title in each node's text area, then insert relevant images in the designated image zones. Colors can be adjusted by milestone period or importance level, and the central connecting line thickness and style can be modified for emphasis. The 4:3 ratio automatically adapts to all screen sizes.
-
Recommended For
Executive teams, marketing departments, and HR professionals presenting company history, organizational growth, and project achievements. Suitable for startup milestone sharing, project team progress documentation, academic research timelines, and corporate milestone celebrations in investor meetings and recruitment presentations.
-
Slide Structure
Four nodes connected by a central line in cluster formation. Nodes are color-coded: orange (2040), olive (2039), and black (2037–2038), each with separate text areas (year, title, description) and image zones. Two-slide set provides color theme variations with gray and blue background options.
Related Products
-

Company History Mini Diagram – Clear and Concise Timeline
#Company Introduction #Diagram #History
-

History Flag Shape Diagram - Company Growth and Vision
#Company Introduction #Diagram #History
-

Business History Diagram – Visualizing Organizational Growth
#Company Introduction #Diagram #History
-

Business History Connection Diagram
#Company Introduction #Diagram #History
