Facility Utilization Analysis on Site – A Tool for Operational Optimization
RB0100046_7
- Last Update 03/06/2025
- File Size 1.4MB
- # of Slides 2
- File Format PPTX
- Slide Ratio 4:3
- Color
Keywords
- #Content-Based Slides
- #Design-Based Slides
- #Product/Service Introduction
- #Operational Plan
- #Diagram
- #Development Plan
- #Production and Technology Development Strategy
- #Cluster
- #Closed Cluster Diagram
- #4:3
- #closed cluster diagram PowerPoint
- #3-item connection diagram slide
- #operational analysis presentation
- #facility utilization PPT
- #cluster diagram template download
About the Product
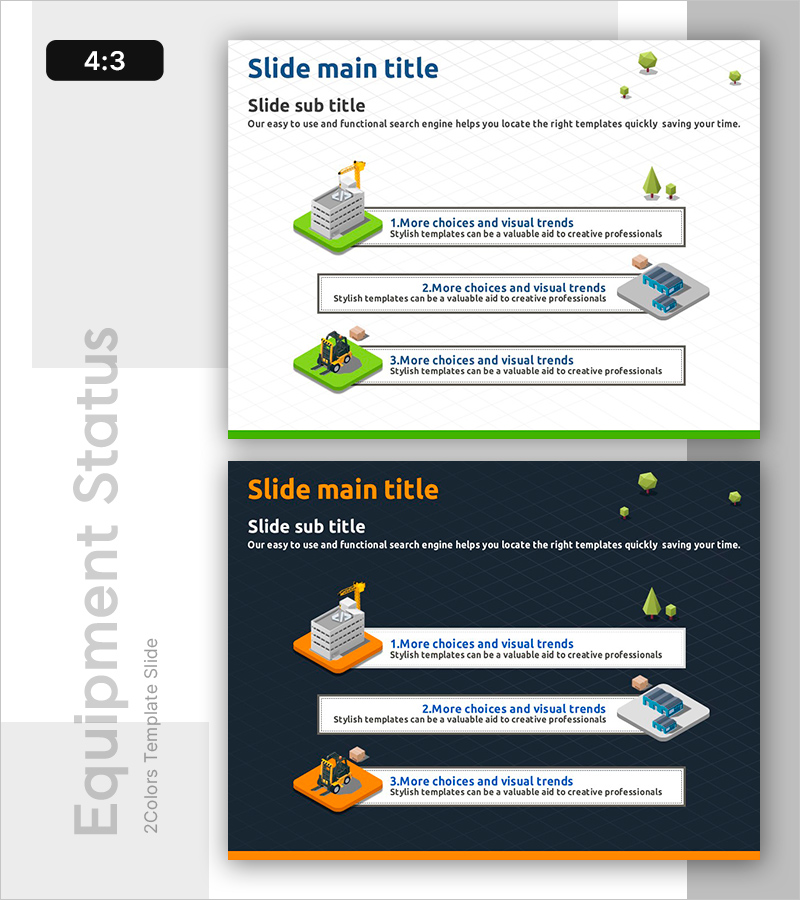
A closed cluster diagram PowerPoint slide designed for facility utilization analysis and operational optimization. This template visually connects three independent items with descriptive text boxes for each element. The design features isometric illustrations (construction equipment, server infrastructure, and logistics equipment) on a dual-tone green and orange background, effectively communicating operational themes. Formatted in 4:3 aspect ratio with 2 slides, all text and color elements are fully editable. This PowerPoint template is ready for immediate use in operational planning, site management, and process analysis presentations.
Usage Points
-
Main Usage
Visualize facility utilization status, operational optimization strategies, and inter-process relationships across three categorized items. The closed cluster structure simultaneously expresses item independence and interdependence, with text boxes enabling detailed explanations for each component.
-
How to Use
Replace item titles and descriptions with specific facility types (construction equipment, IT infrastructure, logistics equipment, etc.) and swap isometric illustrations with industry-relevant icons. Adjust the green and orange background colors and text box styling to match your company's brand identity for presentation use.
-
Recommended For
Operations managers, site managers, production managers, facility investment proposal writers, and process improvement project leaders. Ideal for manufacturing, construction, logistics, and IT operations teams presenting internal reports and executive briefings.
-
Slide Structure
2-slide layout. Slide 1: Title and subtitle with 3-item closed cluster diagram (each item includes isometric illustration and text box). Slide 2: Dark background variant (dark blue with orange accents) using identical structure. Visual connection lines and arrows between items express relationships.
Related Products
-

Execution Plan for Wind Energy Integration – Technology Development and Production Strategy
#Product/Service Introduction #Operational Plan #Diagram
-

Medicine Development Progress Plan Slide
#Product/Service Introduction #Operational Plan #Diagram
-

Product Development Process Diagram - Visualization of Operations
#Product/Service Introduction #Operational Plan #Diagram
-

Slide for Product Development Plans – Cluster Design
#Product/Service Introduction #Operational Plan #Diagram
