Visualizing Product Development Strategy with Gear Diagram
RM0500010_20
- Last Update 02/22/2025
- File Size 0.5MB
- # of Slides 2
- File Format PPTX
- Slide Ratio 16:9
- Color
Keywords
- #Content-Based Slides
- #Design-Based Slides
- #Product/Service Introduction
- #Operational Plan
- #Diagram
- #Development Plan
- #Production and Technology Development Strategy
- #Cluster
- #Closed Cluster Diagram
- #16:9
- #gear diagram PowerPoint slide
- #product development process template
- #4-stage process diagram
- #operational planning PPT
- #how to create gear diagram in PowerPoint
About the Product
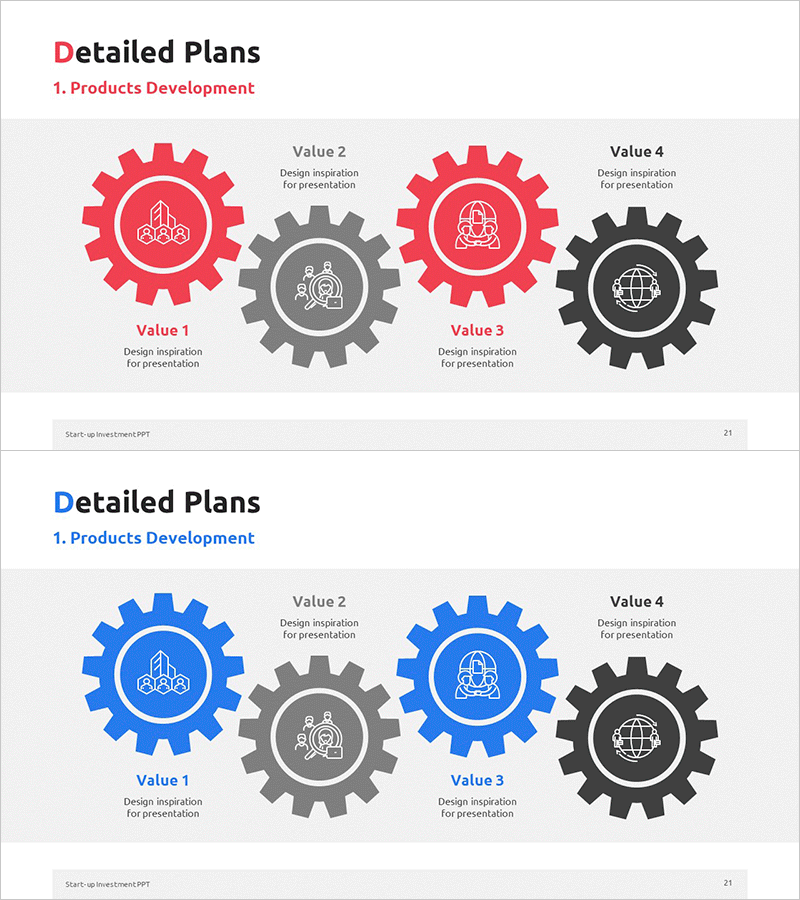
A PowerPoint slide template that visualizes product development strategy through four interlocking gear diagrams. Red, blue, gray, and black gears mesh together to show sequential progression and interdependencies across development stages. The 2-slide set includes both red-tone and blue-tone color versions, with icons positioned at the center of each gear to highlight key elements for each phase. Ideal for presentations, strategic planning documents, and operational plans that require clear process flow communication.
Usage Points
-
Main Usage
Represents product development stages and their interdependencies through an interlocking gear mechanism. Clearly visualizes sequential flow and collaborative structure during strategy planning, operational planning, and project management phases, enhancing audience comprehension.
-
How to Use
Use in strategic presentations, planning meetings, and project kickoff sessions to explain product development roadmaps. Input stage names, responsible departments, and key activities in the text areas at each gear center to clearly communicate team roles and timelines.
-
Recommended For
Recommended for product managers, project managers, operations specialists, and executive reporting materials. Applicable to all business presentations explaining multi-stage processes such as new product development, service improvement, and organizational restructuring.
-
Slide Structure
2-slide set. First slide features four red gears (with central gray and black gears), second slide provides identical structure with blue gears. Each gear has a center circular area for icon and text input; gear teeth serve as connection lines representing interdependencies between stages.
Related Products
-

Medicine Development Progress Plan Slide
#Product/Service Introduction #Operational Plan #Diagram
-

Execution Plan for Wind Energy Integration – Technology Development and Production Strategy
#Product/Service Introduction #Operational Plan #Diagram
-

Product Development Process Diagram - Visualization of Operations
#Product/Service Introduction #Operational Plan #Diagram
-

Facility Utilization Analysis on Site – A Tool for Operational Optimization
#Product/Service Introduction #Operational Plan #Diagram
