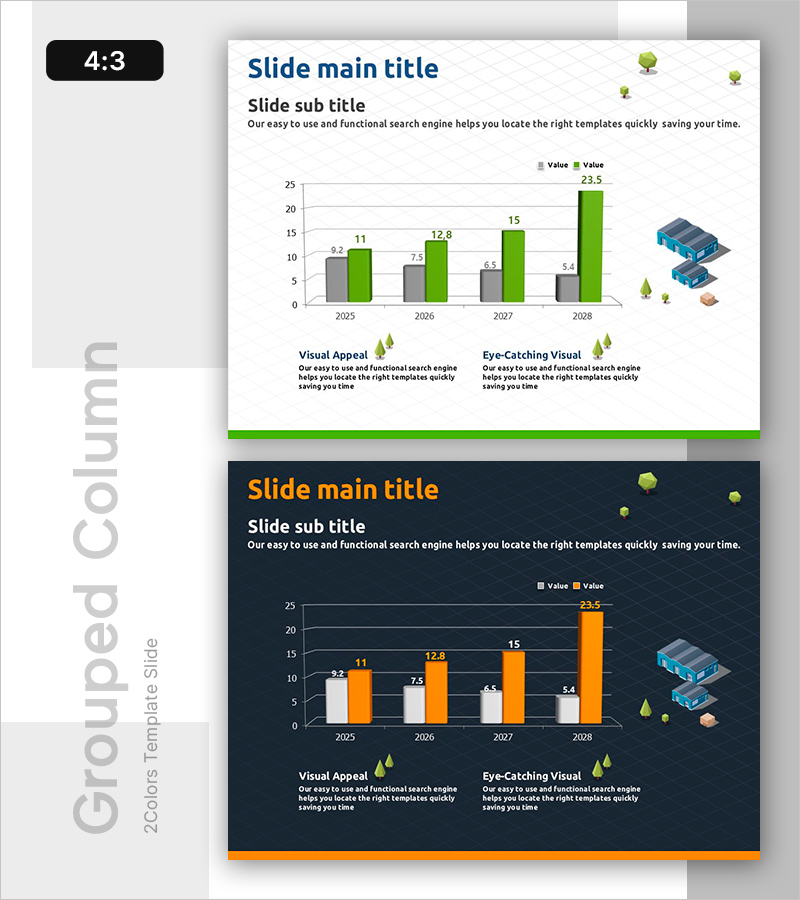
Comparison Graph of Construction Performance by Year
RB0100046_5
- Last Update 03/06/2025
- File Size 1.4MB
- # of Slides 2
- File Format PPTX
- Slide Ratio 4:3
- Color
Keywords
- #Content-Based Slides
- #Design-Based Slides
- #Business Strategy
- #Market and Competitor Analysis
- #Graph
- #Achievements
- #Industry Trends
- #Column
- #Grouped Column
- #4:3
- #grouped bar chart PowerPoint
- #year-over-year comparison slide
- #construction performance template
- #two-series data visualization
- #business performance chart
About the Product
A grouped bar chart PowerPoint slide comparing construction performance across four years from 2025 to 2028. The slide visualizes two data series in gray and green bars, displaying precise values (9.2, 11, 7.5, 12.8, 6.5, 15, 5.4, 23.5) for each year. Construction equipment mockups and nature icons on the right side enhance visual appeal and reinforce the construction industry context. This 4:3 aspect ratio PPTX template is ready for immediate use in presentations and reports.
Usage Points
-
Main Usage
Simultaneously compare two performance metrics across four years to communicate construction achievement trends visually. The distinct gray and green color scheme enables easy differentiation between data series, while precise numerical labels ensure credible information delivery.
-
How to Use
Apply this slide to business performance reports, construction company presentations, and market analysis documents in the year-over-year performance comparison section. The construction equipment mockup and nature icons on the right reinforce industry context. Customize the text areas to add detailed explanations or additional data points.
-
Recommended For
Ideal for construction and real estate companies presenting annual results, project performance reports, investor pitch meetings, and construction industry market analysis. Recommended for project managers, sales professionals, and executives who need to effectively communicate performance data.
-
Slide Structure
Two-slide template with identical grouped bar chart layouts. Each chart features a 4-year X-axis (2025–2028), Y-axis range 0–25, two data series (gray and green bars), legend, and precise value labels. Construction-related visual elements are positioned on the right side of each slide.
Related Products
-

Real Estate Market Trends Chart – Data Analysis and Performance
#Business Strategy #Market and Competitor Analysis #Graph
-

Day and Night Phase Cumulative Progress – Data Visualization for Business Success
#Business Strategy #Market and Competitor Analysis #Graph
-

War Damage Analysis through Graphs
#Business Strategy #Graph #Achievements
-

Food Market Growth Analysis - Insights Through Data Visualization
#Market and Competitor Analysis #Graph #Market Analysis
