Real Estate Market Trends Chart – Data Analysis and Performance
RJ0900002_19
- Last Update 08/16/2025
- File Size 0.1MB
- # of Slides 2
- File Format PPTX
- Slide Ratio 16:9
- Color
Keywords
- #Content-Based Slides
- #Design-Based Slides
- #Business Strategy
- #Market and Competitor Analysis
- #Graph
- #Achievements
- #Industry Trends
- #Column
- #Segmented Column
- #16:9
- #stacked bar chart PowerPoint
- #real estate market trends chart
- #data visualization slide
- #year-over-year trend graph
- #PowerPoint chart template download
About the Product
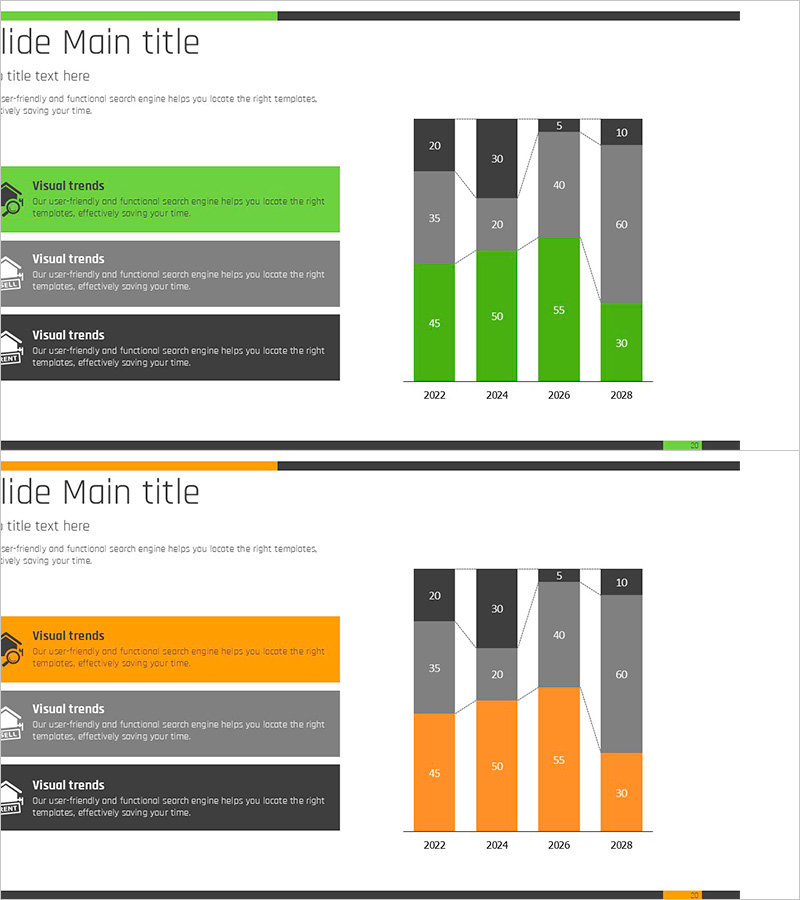
A PowerPoint slide featuring a stacked bar chart that visualizes real estate market trends across four years of data. The vertical bar chart uses two data series in green and gray tones to simultaneously display year-over-year growth and compositional ratios from 2022 to 2028. The left side includes three icon-based text boxes for highlighting key insights. This slide template is ready to use for real estate market analysis presentations, performance reports, investment proposals, and data-driven business communications.
Usage Points
-
Main Usage
Visualize real estate market growth trends and compositional ratios across years to communicate market analysis and performance reports clearly. The stacked bar chart enables viewers to grasp overall scale changes and each series' contribution at a glance, while icon-based text boxes emphasize critical insights.
-
How to Use
Use in real estate market analysis presentations, quarterly or annual performance reports, investment proposals, and marketing strategy presentations to strengthen data-driven persuasion. The 2-slide set presents the same data in two color themes (green and orange) so you can select the version matching your presentation context.
-
Recommended For
Real estate professionals, market analysts, investment managers, marketing strategists, and executives preparing data-driven presentations. Particularly effective when time-series data comparison and compositional ratio analysis are required.
-
Slide Structure
Each slide contains a title area, three icon-based text boxes on the left (Visual trends), and a vertical stacked bar chart on the right. The chart displays four years (2022–2028), two data series (green and gray), with numerical labels within each bar segment for high information density.
Related Products
-

Natural Vertical Bar Segment Chart – A Key Tool for Market Analysis
#Business Strategy #Market and Competitor Analysis #Graph
-

Red Green Market Analysis Slide – Effective Data Visualization
#Business Strategy #Market and Competitor Analysis #Diagram
-

Target Analysis Subdivided Vertical Bar Graph – Harmonizing Blue and Green
#Market and Competitor Analysis #Graph #Customer Analysis
-

Yellow Green Detailed Analysis Chart - Visualizing Market Trends
#Business Strategy #Market and Competitor Analysis #Diagram
