Investment Ratio Comparison – Market Share Analysis
RB0100046_4
- Last Update 03/06/2025
- File Size 1.5MB
- # of Slides 2
- File Format PPTX
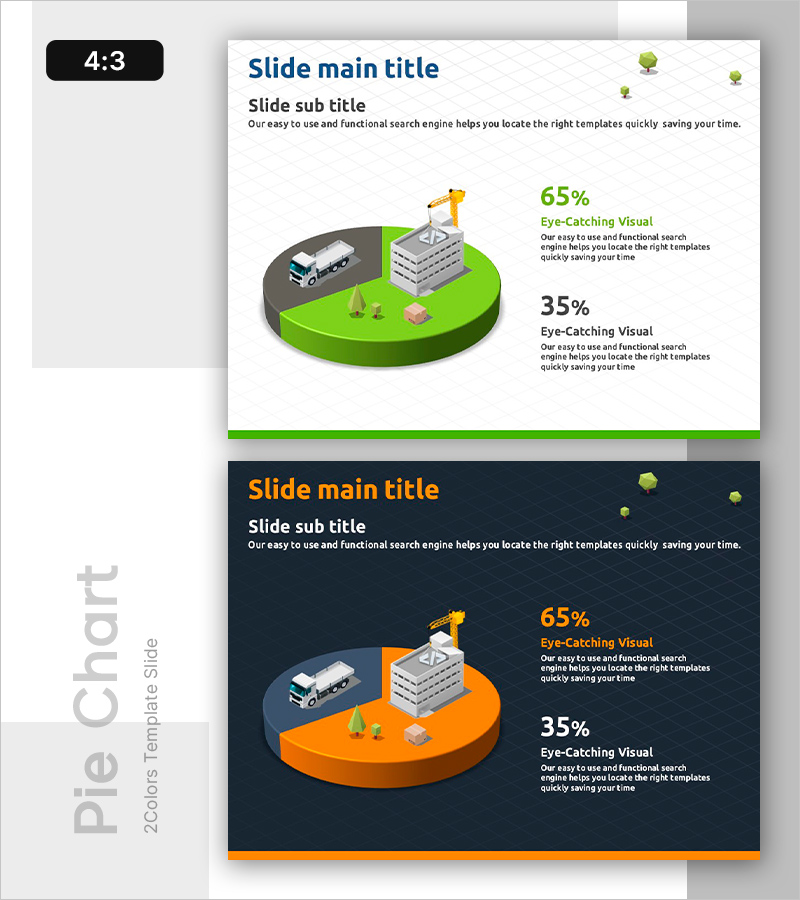
- Slide Ratio 4:3
- Color
Keywords
About the Product
A visually engaging 2-segment pie chart PowerPoint slide designed to present investment ratios and market share analysis. Available in two color versions—green and orange—each slide features 3D isometric illustrations (construction equipment, building, delivery vehicle) paired with percentage values (65%, 35%). The 4:3 aspect ratio template includes 2 slides ready for immediate editing. Perfect for financial reports, business plans, investor pitches, and market analysis presentations where clear ratio comparison is essential.
Usage Points
-
Main Usage
Clearly visualize the relationship between two key metrics—investment allocation, market share, business proportion, or budget distribution. The pie chart segments instantly communicate what percentage each component represents of the whole, making complex ratio data immediately understandable.
-
How to Use
Insert into financial reports, business plans, investor presentations, or market analysis decks where ratio comparison is needed. Edit text labels and percentage values to match your data, then select the color version (green or orange) that best aligns with your presentation's overall design theme.
-
Recommended For
Finance professionals, executives, marketing teams, business development managers, and investor relations specialists presenting ratio-based data. Ideal for situations where two primary components must be compared and their relative proportions emphasized to stakeholders.
-
Slide Structure
2-slide template. Each slide features a title and subtitle area at the top, a 2-segment pie chart (65% vs 35%) in the center, and percentage values with descriptive text on the right. A 3D isometric illustration positioned on the left provides visual balance and context.
Related Products
-

Coffee Cup Pie Chart – Market Share Analysis
#Market and Competitor Analysis #Graph #Market Share
-

Donut Chart: Urban Energy Source Breakdown – Market Share Analysis
#Market and Competitor Analysis #Graph #Market Share
-

Vegetable Competition Pie Chart – Market Share Analysis
#Market and Competitor Analysis #Graph #Market Share
-

Pie Chart Visualizing Coffee Ingredients Ratio - Market Share Analysis
#Market and Competitor Analysis #Graph #Market Share
