Goal Performance Pie Chart – Market Share and Future Outlook
RB0100041_7
- Last Update 03/05/2025
- File Size 0.7MB
- # of Slides 2
- File Format PPTX
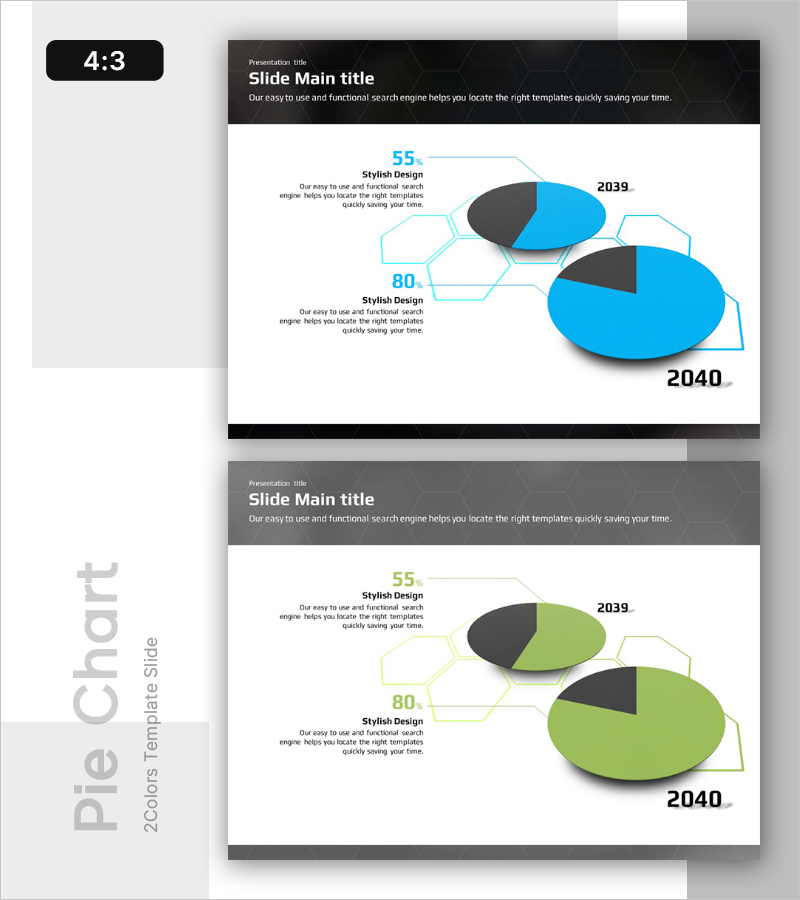
- Slide Ratio 4:3
- Color
Keywords
About the Product
A pie chart PowerPoint slide that displays market share and future outlook side by side for instant comparison. The design uses bright blue and dark black colors to create clear data distinction, with hexagonal connector lines linking each data point (55%, 80%) to descriptive text. Composed of 2 slides in 4:3 aspect ratio PPTX format, fully editable for immediate use. This presentation template works well for goal performance analysis, market analysis, business status reports, and various corporate presentations.
Usage Points
-
Main Usage
Visualize market share changes across two time periods (2039 and 2040) using pie charts to communicate both business performance and future projections simultaneously. Numerical values (55%, 80%) and descriptive text beside each chart emphasize key data, while hexagonal connector lines clearly organize information hierarchy.
-
How to Use
Use in executive reports, quarterly performance presentations, market analysis sessions, and investor briefings to explain goal achievement and market changes. Simply replace the pie chart colors and values with your own data for immediate deployment.
-
Recommended For
Ideal for executives, marketing teams, sales teams, and strategic planning departments presenting quarterly performance analysis, market share trends, and goal achievement comparisons. Particularly effective when comparing data across two time periods side by side.
-
Slide Structure
2-slide layout. Each slide features 2 pie charts (small upper chart and larger lower chart) with numerical values (55%, 80%) and 'Stylish Design' descriptive text on the left, connected via hexagonal lines. Year labels (2039, 2040) on the right clearly indicate time progression.
Related Products
-

Blue Red Pie Chart and Bar Chart – Market Share Analysis
#Market and Competitor Analysis #Graph #Market Share
-

Colors Theme Presentation Template - Map & Donut Chart
#Market and Competitor Analysis #Graph #Market Share
-

Men's Recommended Daily Intake Visualization – A Slide for Healthy Men
#Market and Competitor Analysis #Graph #Customer Analysis
-

Market Share Analysis with 3 Simple Pie Charts
#Market and Competitor Analysis #Graph #Market Share
