Purchase Volume Comparison Analysis Circle Graph – Understanding Market Share
RJ0400046_6
- Last Update 05/29/2025
- File Size 0.3MB
- # of Slides 2
- File Format PPTX
- Slide Ratio 16:9
- Color
Keywords
- #Content-Based Slides
- #Design-Based Slides
- #Product/Service Introduction
- #Market and Competitor Analysis
- #Graph
- #Development Status
- #Market Share
- #Circles
- #Pie Chart
- #16:9
- #pie chart PowerPoint slide
- #market share analysis template
- #purchase volume comparison chart
- #data visualization slides
- #circle graph presentation
About the Product
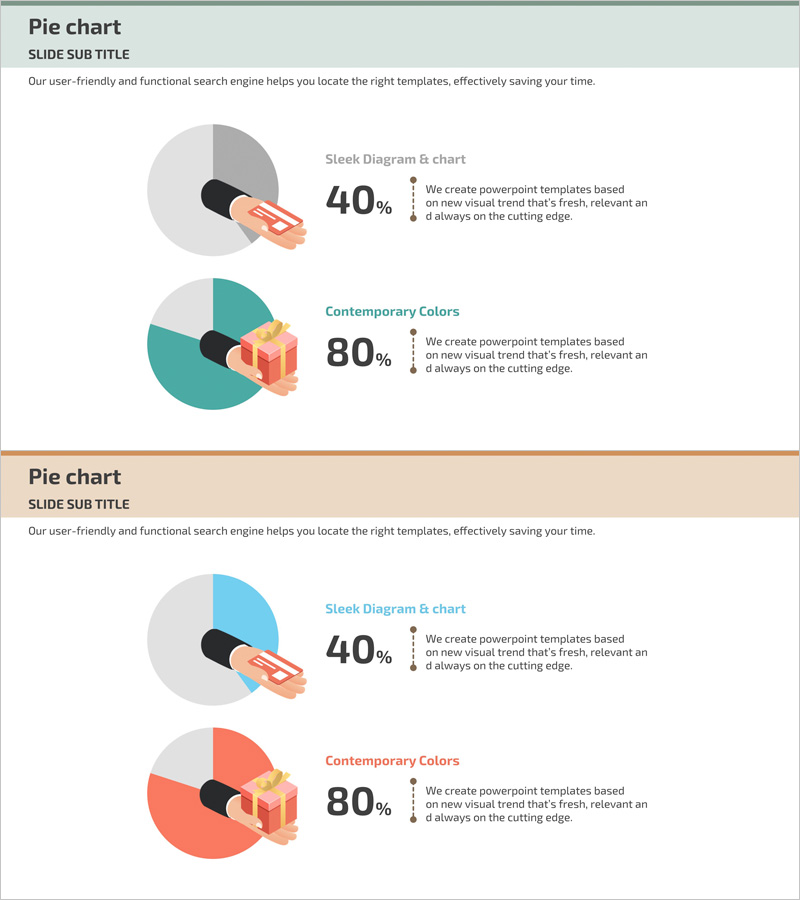
A 2-slide PowerPoint presentation featuring pie charts designed to visualize purchase volume comparison and market share analysis. Each slide displays two pie chart segments in a cohesive layout, utilizing a color palette of gray, teal, and coral tones to clearly differentiate data categories. 3D isometric icons and accompanying text descriptions are strategically placed to convey both numerical information and contextual insights. Provided in 16:9 widescreen PPTX format, these slides are fully editable and ready to be customized with your own data and branding.
Usage Points
-
Main Usage
Effectively communicate market share, sales volume comparisons, and customer composition ratios in business presentations using pie chart visualization. The 2-segment layout enables side-by-side comparison of two data sets, making it ideal for executive reports, marketing analysis presentations, investor pitch decks, and quarterly performance reviews.
-
How to Use
Simply replace the pie chart values and labels with your own data. Color schemes can be adjusted to match your corporate branding guidelines, and text description areas can be expanded with detailed analysis to enhance audience comprehension. The 16:9 aspect ratio ensures optimal display on modern projectors and digital screens.
-
Recommended For
Finance teams presenting revenue composition analysis, marketing departments analyzing customer demographics, sales teams reporting regional sales distribution, executives delivering quarterly performance updates, and investors reviewing business portfolio breakdowns. Suitable for any data-driven business presentation requiring clear ratio visualization.
-
Slide Structure
2-slide deck with dual pie chart segments on each slide. Left side features color-coded pie charts in gray, teal, and coral tones with 3D isometric icons; right side displays percentage values and explanatory text, enabling simultaneous data presentation and interpretation.
Related Products
-

Development Status Pie Chart – Efficient Data Delivery
#Product/Service Introduction #Market and Competitor Analysis #Graph
-

Modern Theme Pie Chart – Market Share Analysis
#Product/Service Introduction #Market and Competitor Analysis #Graph
-

4 Donut Charts for Data Visualization – Easy Presentation Template
#Product/Service Introduction #Market and Competitor Analysis #Graph
-

Securities Business Analysis Circle Graph
#Product/Service Introduction #Market and Competitor Analysis #Graph
