Chalkboard Chalk Theme Pie Chart
RJ0400025_5
- Last Update 05/24/2025
- File Size 3.4MB
- # of Slides 2
- File Format PPTX
- Slide Ratio 16:9
- Color
Keywords
- #Content-Based Slides
- #Design-Based Slides
- #Product/Service Introduction
- #Market and Competitor Analysis
- #Graph
- #Development Status
- #Market Share
- #Circles
- #Pie Chart
- #16:9
- #pie chart PowerPoint slide
- #circular graph presentation
- #data visualization slide
- #chalkboard theme chart
- #ratio comparison PPT
About the Product
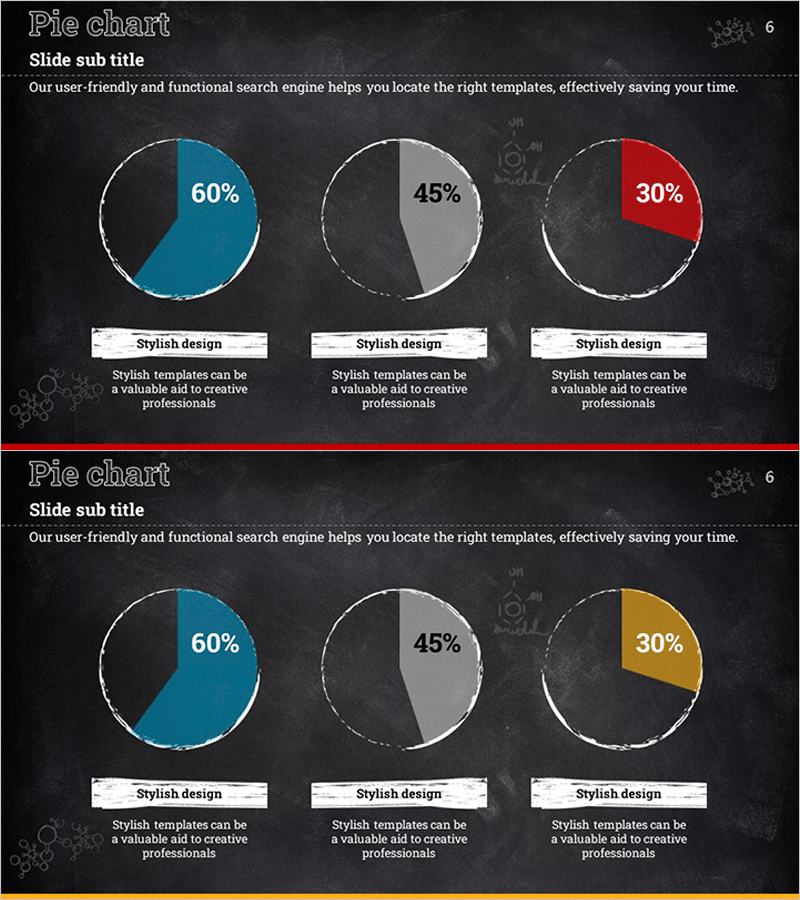
A 2-slide PowerPoint set featuring pie charts with a chalkboard chalk theme. These circular graphs effectively display the proportion of three data categories, ideal for market analysis, service composition, and budget allocation presentations. The design combines a dark chalkboard background with white borders and color-coded segments in blue, gray, and red on the first slide, and blue, gray, and gold on the second. Each chart includes a descriptive text area below for immediate use in presentations and reports. Available in 16:9 widescreen PPTX format, fully editable in all PowerPoint versions.
Usage Points
-
Main Usage
Clearly visualize the proportion and composition of three data categories using pie chart graphics. Effectively communicate market share, revenue breakdown, customer distribution, budget allocation, and service composition ratios to audiences.
-
How to Use
Edit the pie chart segments and percentages with your own data, then input category names and descriptions in the text boxes below. Insert into presentation slides, business reports, marketing plans, and product introductions to enhance audience comprehension of data insights.
-
Recommended For
Marketing professionals, business analysts, strategists, and executives presenting market analysis, performance reports, and strategic initiatives. Ideal for startup pitch decks, business plans, departmental performance reviews, and customer segmentation strategy presentations.
-
Slide Structure
Two-slide layout. First slide features three pie charts in blue, gray, and red color schemes. Second slide displays three pie charts in blue, gray, and gold combinations. Charts show varying proportions (60%, 45%, 30% examples) with white borders on dark backgrounds, each accompanied by a 'Stylish design' label and descriptive text area.
Related Products
-

Pie Chart of the Development Status of the Snow Mountain Theme
#Product/Service Introduction #Market and Competitor Analysis #Diagram
-

Construction Development Status Chart – Key to Construction Market Analysis
#Product/Service Introduction #Market and Competitor Analysis #Graph
-

Space Illustration Theme Circle Graph
#Product/Service Introduction #Market and Competitor Analysis #Graph
-

Modern Theme Pie Chart – Market Share Analysis
#Product/Service Introduction #Market and Competitor Analysis #Graph
