Blue Red Pie Chart and Bar Chart – Market Share Analysis
RJ0500001_7
- Last Update 06/08/2025
- File Size 1.2MB
- # of Slides 2
- File Format PPTX
- Slide Ratio 16:9
- Color
Keywords
- #Content-Based Slides
- #Design-Based Slides
- #Market and Competitor Analysis
- #Graph
- #Market Share
- #Future Outlook
- #Horizontal Bar
- #Circles
- #Horizontal Bar Chart
- #Pie Chart
- #16:9
- #pie chart PowerPoint slide
- #horizontal bar chart template
- #market share analysis PPT
- #data comparison slide
- #business presentation template
About the Product
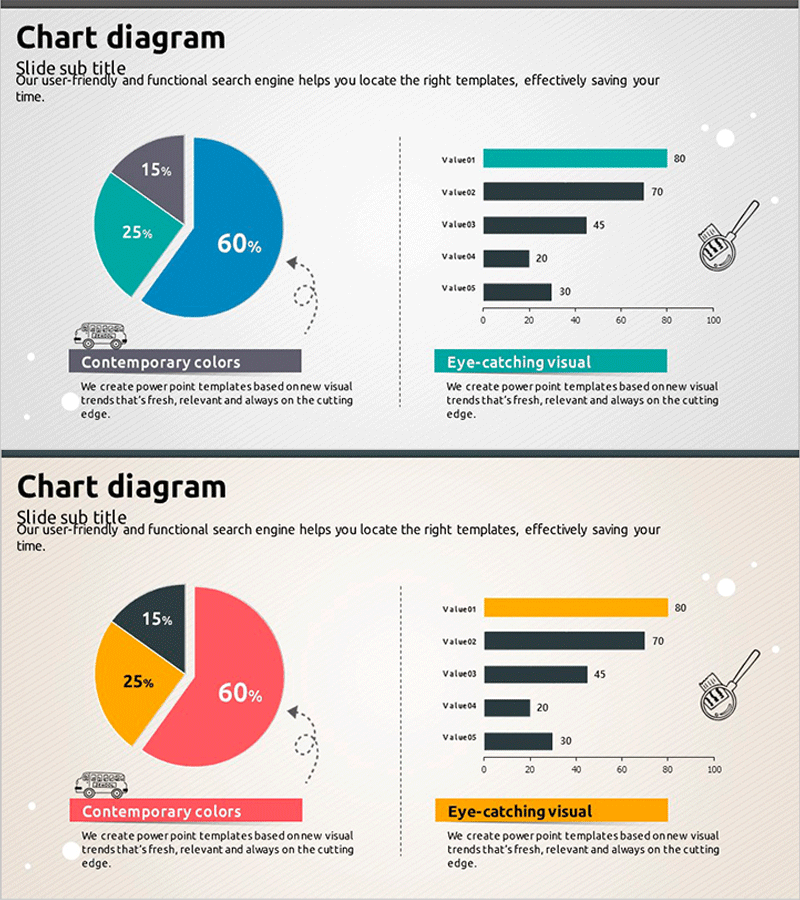
A 2-slide PowerPoint presentation optimized for market share analysis and competitive comparison. The first slide features a 3-segment pie chart (60%, 25%, 15%) visualizing market composition, while the second slide displays a horizontal bar graph with 5 data points for numerical comparison. Multi-color coding in blue, teal, red, yellow, and black clearly differentiates each dataset, with icons and text boxes enhancing information clarity. Delivered in 16:9 widescreen PPTX format, fully editable and ready for immediate use in presentations, reports, and business proposals.
Usage Points
-
Main Usage
Simultaneously express ratio and numerical data such as market share, competitor comparison, sales performance, and customer composition. The pie chart provides instant overview of overall composition while the horizontal bar graph enables detailed item-by-item comparison, strengthening persuasiveness.
-
How to Use
Apply to market analysis sections in business reports, competitive landscape pages in investor pitch decks, and target analysis portions of marketing plans. Replace pie chart percentages and bar graph values with your own data for immediate presentation use.
-
Recommended For
Executives, marketing managers, sales directors, consultants, and analysts explaining market conditions and competitive positioning. Effective for quarterly performance reviews, new business proposals, and client reporting meetings requiring data credibility.
-
Slide Structure
Slide 1: 3-segment pie chart (60% blue, 25% teal, 15% black) with icons and text boxes / Slide 2: 5-item horizontal bar graph (Value01-05 in teal, black, black, black, black) with 0-100 scale axis. Both slides unified with gray background and white typography.
Related Products
-

Goal Performance Pie Chart – Market Share and Future Outlook
#Market and Competitor Analysis #Graph #Market Share
-

Galaxy Theme Market Share Pie Chart
#Product/Service Introduction #Market and Competitor Analysis #Graph
-

Target Market Share Analysis – Visualizing Market Analysis with Pie Chart
#Market and Competitor Analysis #Graph #Other
-

Medical Development Status Pie Chart – Visualizing Market Share
#Product/Service Introduction #Market and Competitor Analysis #Graph
