Eco-friendly Donut Graph Analysis – Insights on Market Trends
RB0100040_5
- Last Update 03/05/2025
- File Size 0.4MB
- # of Slides 2
- File Format PPTX
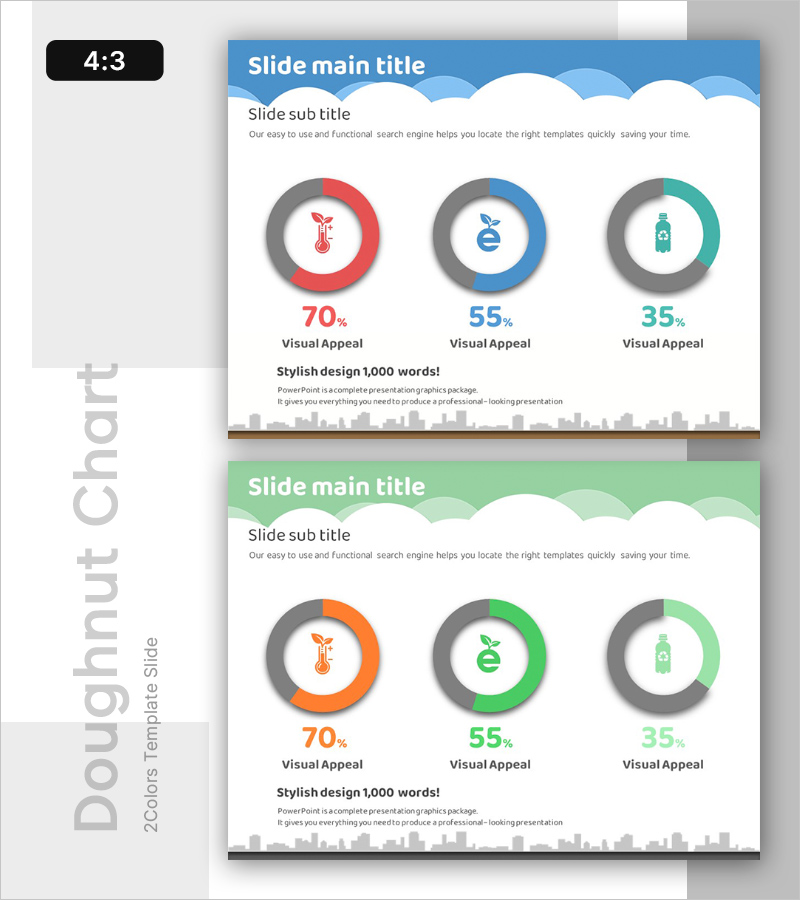
- Slide Ratio 4:3
- Color
Keywords
About the Product
A professional donut chart PowerPoint slide visualizing eco-friendly product market distribution across three segments in red, blue, and teal colors. Each segment displays percentage values (70%, 55%, 35%) with centered icons representing different product categories. The design features a cloud-shaped header and city skyline footer for a contemporary look. Two-slide set includes color variations (blue, orange, green) to match different presentation themes. Ideal for market analysis, competitive benchmarking, and customer preference studies requiring clear ratio visualization in business presentations.
Usage Points
-
Main Usage
Visualize ratio-based data through a donut chart format to communicate market share, customer composition, and product category distribution at a glance. The centered icon area emphasizes the topic, while percentage values across three segments ensure accurate data communication.
-
How to Use
Place the two slides in market analysis, competitive comparison, or customer research sections to present data-driven insights. Edit segment values and labels to match your actual data, and use color-variant slides to adjust document tone and visual consistency throughout the presentation.
-
Recommended For
Marketing professionals, business analysts, and strategists presenting market research findings, product portfolio composition, and customer segmentation. Effective for business plans, marketing proposals, and investor pitch decks requiring quantitative data credibility.
-
Slide Structure
Slide 1: Blue header background with three-segment donut chart in red, blue, and teal; centered icons in each segment (thermometer, water droplet, bottle shapes); percentage values and labels below. Slide 2: Identical structure with orange and green color variations. 4:3 aspect ratio, 2-slide set.
Related Products
-

Pie Chart for Decimal Ratio Analysis – Market Share Status
#Market and Competitor Analysis #Graph #Market Status
-

Visualizing Value Ratios with Pie Charts – Essential Presentation Template
#Market and Competitor Analysis #Diagram #Graph
-

Distribution Graph of Food Materials – Market Status Chart
#Market and Competitor Analysis #Graph #Other
-

Guide to Admission Evaluation Criteria with Donut Chart
#Market and Competitor Analysis #Graph #Market Status
