Visualizing Value Ratios with Pie Charts – Essential Presentation Template
RJ0600093_8
- Last Update 07/16/2025
- File Size 1MB
- # of Slides 2
- File Format PPTX
- Slide Ratio 16:9
- Color
Keywords
About the Product
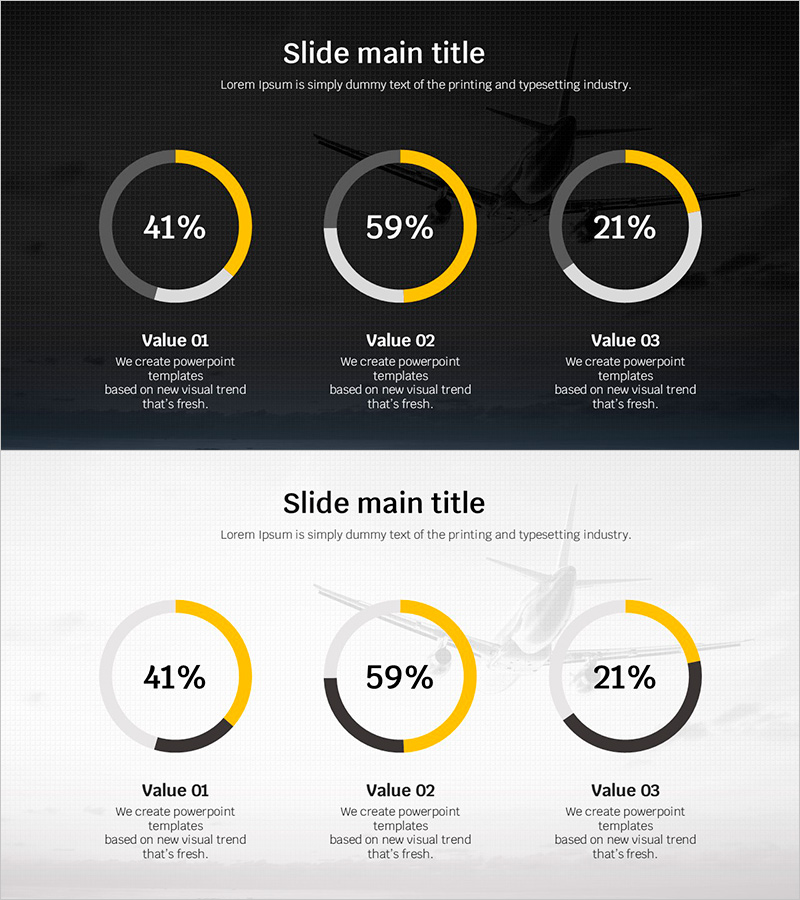
A PowerPoint slide featuring three donut charts displaying data ratios with gold, gray, and white color accents. The template includes two layout variations: a dark background version for professional presentations and a light background version for printed reports. Each chart displays percentage values (41%, 59%, 21%) centered within the donut, with Value 01-03 labels and descriptive text below. Fully editable and ready to use for business reports, performance presentations, and data analysis slides.
Usage Points
-
Main Usage
Visualize the proportional relationships of three data categories using donut charts. Ideal for presenting business metrics, market share, budget allocation, customer demographics, and other ratio-based data in a clear, visually engaging format.
-
How to Use
Use the dark background slide for professional presentations and the light background slide for printed documents or reports. Simply replace the chart values and labels with your own data. Colors and styling can be easily adjusted to match your brand guidelines.
-
Recommended For
Executive reports, quarterly performance presentations, marketing analysis, investor pitch decks, and business planning documents. Recommended for managers, analysts, marketers, and business professionals who need to present ratio-based data.
-
Slide Structure
Two-slide template: Slide 1 features dark background with three donut charts (41%, 59%, 21%); Slide 2 has light background with identical chart structure. Each chart includes Value labels and description text areas below. 16:9 widescreen format, PPTX file with all elements fully editable.
Related Products
-

Donut Chart: Feature Usage Ratio in Mobile Banking
#Market and Competitor Analysis #Diagram #Graph
-

Visualizing Market Share with Detailed Item Analysis Chart
#Market and Competitor Analysis #Diagram #Graph
-

Visualizing Market Share with Plus Donut Chart
#Market and Competitor Analysis #Diagram #Graph
-

Market Share Analysis Graph by Technology – Competition and Collaboration
#Market and Competitor Analysis #Diagram #Graph
